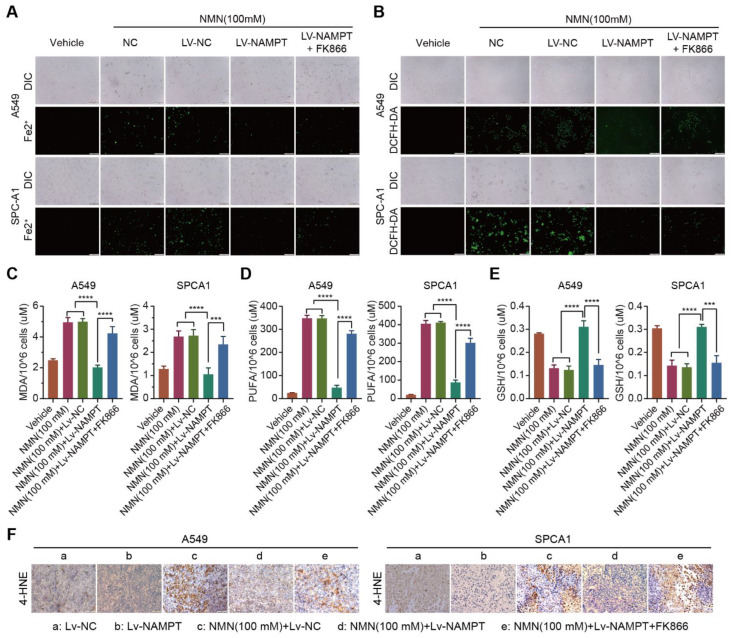
Figure 6.
High-dosage NMN induces ferroptosis via its metabolite NAM. (A) The A549 and SPCA1 mitochondrial iron concentrations determined through Mito-FerroGreen labeling using cell immunofluorescence in indicated groups; scale bar: 200 μm. (B) ROS production in A549 and SPCA1 cells detected via DCFH-DA and immunofluorescence analysis in indicated groups; scale bar: 200 μm. (C–E) MDA (C), PUFA (D), and GSH (E) levels in A549 and SPCA1 cells examined via ELISA assay in indicated groups (n = 5). (F) Representative immunohistochemistry staining of 4-HNE in A549 and SPCA1 tumor nodules; scale bar: 50 μm. *** p < 0.001; **** p < 0.0001.

