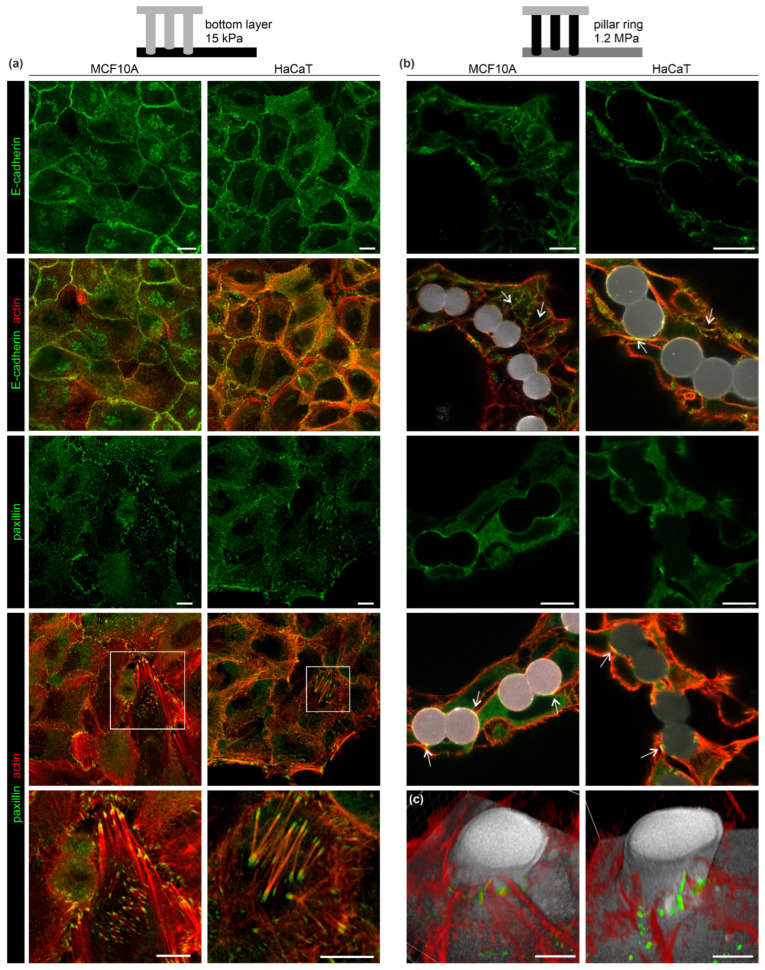
Figure 3.
The EPC geometry modulated cell-cell and cell-matrix adhesion. MCF10A and HaCaT were cultivated in EPCs for six days. Cell morphologies were compared at (a) the planar bottom layer and (b) the pillar ring topography. Cells were fixed and stained for AJs (E-cadherin) and FA complex (paxillin) marker proteins. White arrowsindicate FA and AJ formation along the pillar surface (gray). Merged images show marker protein and actin cytoskeleton co-localization. Scale bars = 10 µm. (c) 3D reconstructions of two independent confocal image stacks. Cross-sections (5–10 µm above the bottom substrate) show the spatial proximity of F-actin structures and paxillin spots with the pillar and planar substrate (gray). Scale bars = 5 µm.

