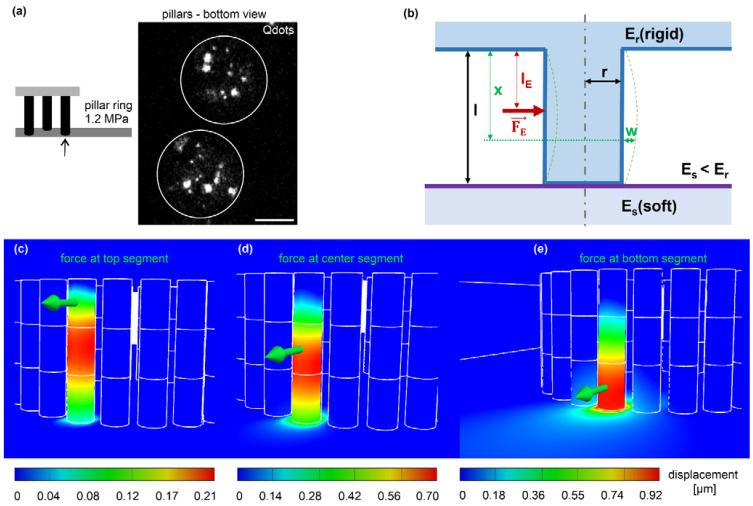
Figure 4.
The theoretic framework of cell force calculation from pillar displacement. (a) Micrograph shows the cross-section of two adjacent pillars (white outlines) with incorporated fluorescent QD dot aggregates to track pillar displacements (confocal image plane: 5 µm distance from the bottom layer). Scale bar = 5 µm. (b) Analytic approach for beam bending (blue) with bending parameters used to calculate forces (red). An external single point force FE applied in the distance from the rigid top layer lE (blue) and distance x in which the displacement w was imaged; Er = rigid pillar and the top layer, Es = soft planar bottom layer, l = pillar length and r = pillar radius. (c–e) FEM simulations with identical geometrical and material properties for the analytical approximation were used. A representative point force (green arrow) of 189 nN was applied to the top (c), center (d), and bottom (e) segments. Analyzing the FEM simulation results with the analytical approximation (Supplementary File S1), we received a force of 189 nN.

