
Fig. 1 |. Chromatin-binding dynamics of GAF shown by SPT in live Drosophila hemocytes.
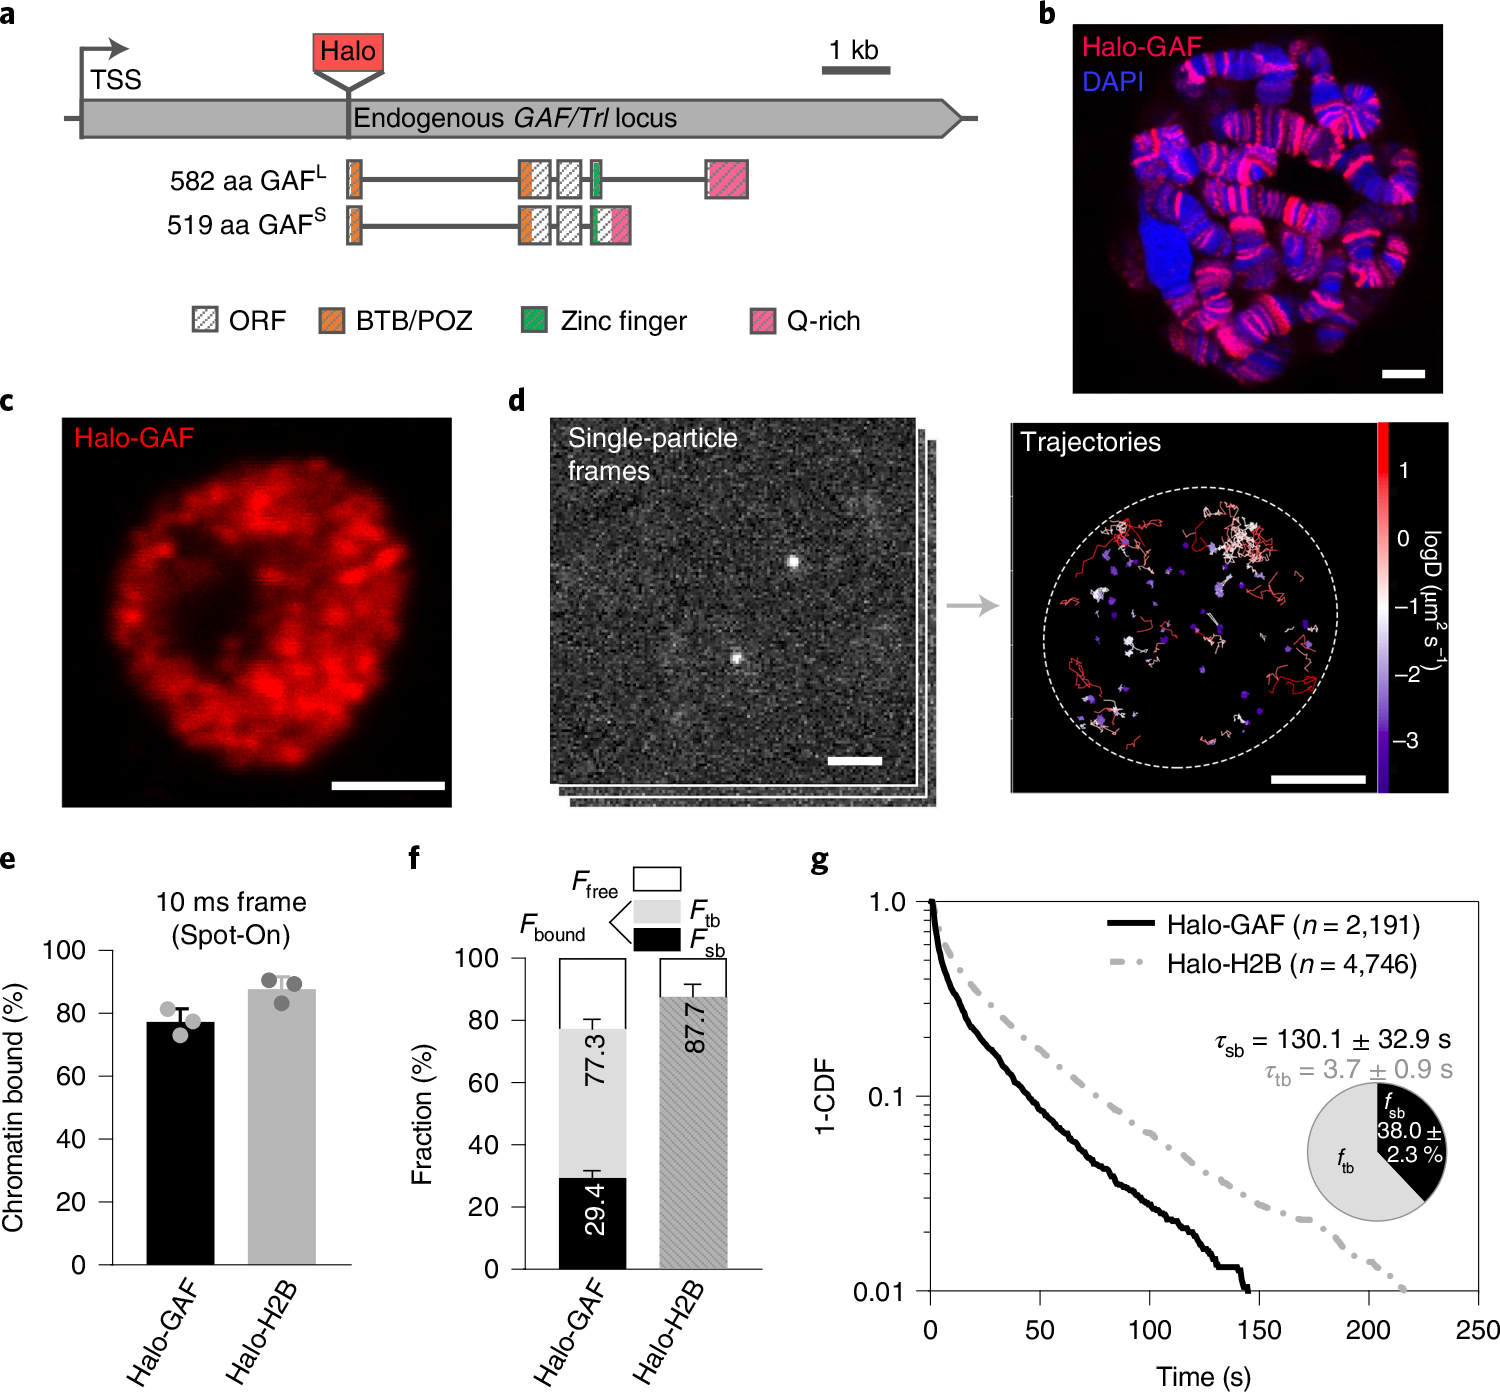
a, Diagram of HaloTag (Halo) knock-in at the N terminus of endogenous GAF/Trl locus. Protein domains in color. TSS, transcription start site. C-terminal GAF-HaloTag fusions for two splicing isoforms GAFS (short) and GAFL (long) are shown in Supplementary Fig. 1. b, Halo-GAF binds to specific polytene chromosome loci in fixed third instar larval salivary gland nuclei, revealed by JF552 fluorescence (red); DNA counterstained with DAPI (blue). Scale bar, 5 μm. c, Confocal distribution of Halo-GAF (JF552) foci in fixed third instar larval hemocyte nuclei (predominantly diploid plasmatocytes in G2 phase of the cell cycle). Scale bar, 2 μm. d, SPT frames and superimposed fast-tracking trajectories of Halo-GAF in live hemocytes, color-coded according to diffusion coefficients. Dashed oval marks the nucleus. Scale bar, 2 μm. e, Spot-On kinetic modeling of fast-tracking data shows chromatin bound and free fractions for Halo-GAF and Halo-H2B. Results are mean ± s.d from three biological replicates. Scale bar, 2 μm. f, Chromatin-free fraction , global stable- and transient-binding fractions ( and ) of Halo-GAF extracted from fast- and slow-tracking data ( biological replicates, e) and ( resamplings, g), Results are mean ± s.d. with error propagation for from the error bars in e and g. g, Survival-probability curves (1-CDF) plotted from apparent dwell times of thousands of single-particle chromatin-binding events for Halo-GAF. Average residence times for stable- and transient- binding by Halo-GAF are corrected by using Halo-H2B as a standard. Pie charts show stable- and transient-binding fractions. Mean and s.d. from bootstrap after resampling 100 times are provided.