
Extended Data Fig. 4 |. Live-cell SPT and FRAP diffusive parameters for Halo-GAF mutants.
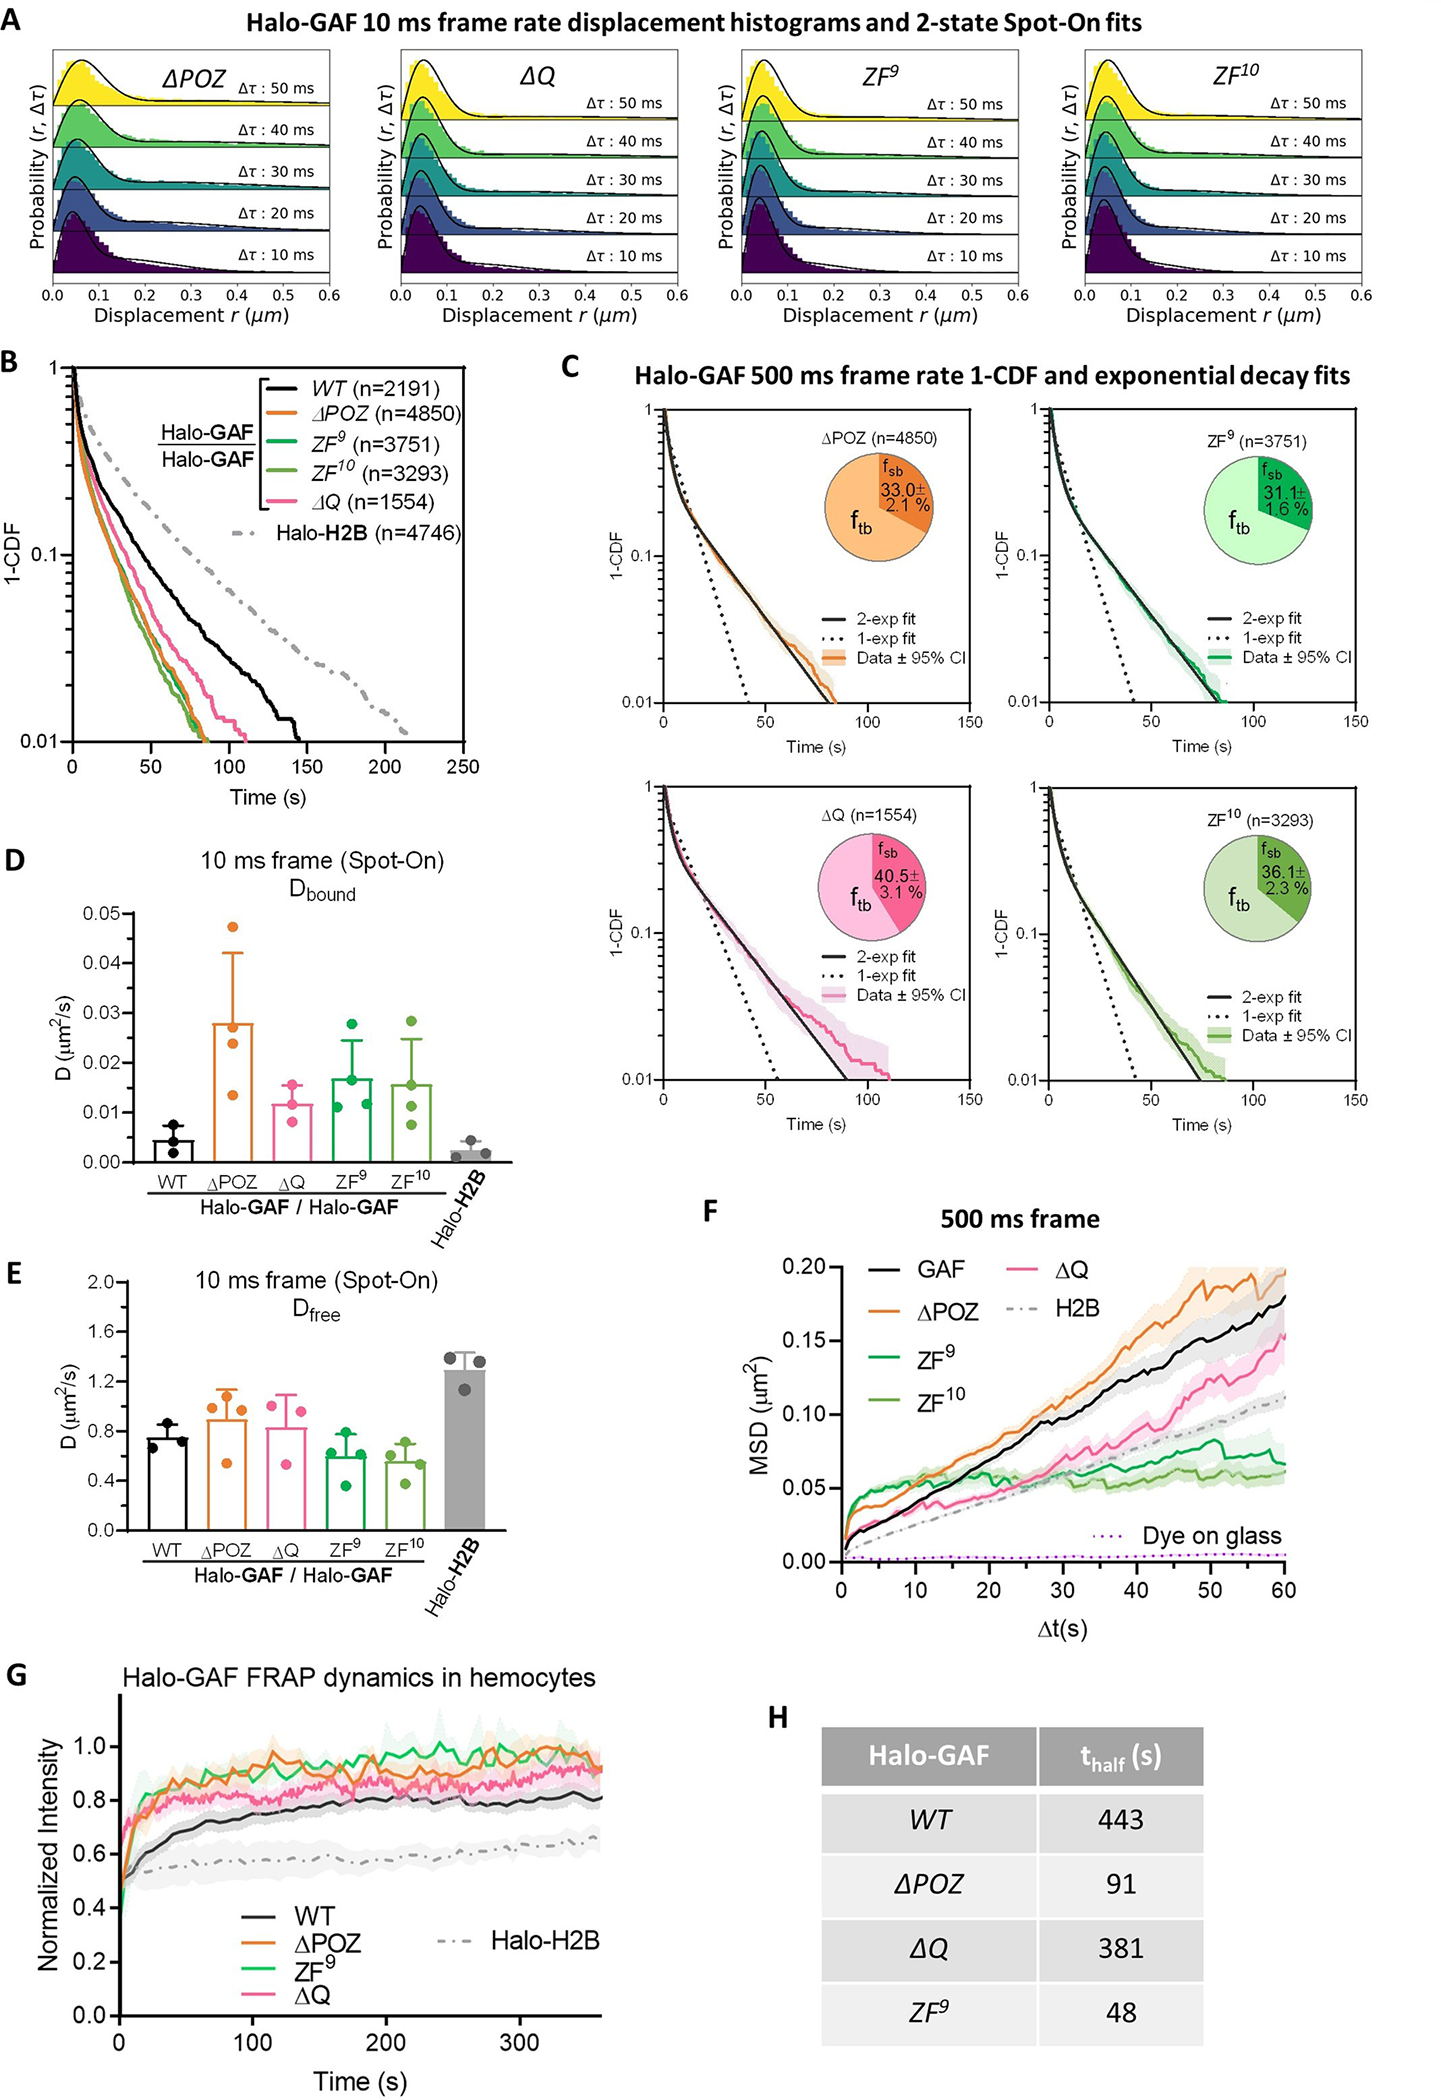
(A) Spot-On fits of fast-tracking data for Halo-GAF mutants (see Extended Data Fig. 1b for WT). (B) Survival probability curves (1-CDF) from apparent dwell times of >1,000 single-molecule chromatin-binding events, for WT and mutant Halo-GAF. (C) One-component and two-component exponential fit of survival probabilities (1-CDF) from slow tracking data (with 95% CI, confidence interval) of Halo-GAF mutants (see Extended Data Fig. 2e for WT). Pie charts show the stable-binding and transient-binding fractions derived from two-component fits. (D) Diffusion coefficients of bound fraction for Halo-GAF and Halo-H2B derived by Spot-On. Results are mean ± SD ( biological replicates for Halo-GAF WT, ΔQ and Halo-H2B, biological replicates for the remaining conditions). (E) Diffusion coefficients of free fraction () for Halo-GAF and Halo-H2B derived by Spot-On. Results are mean ± SD ( biological replicates for Halo-GAF WT, ΔQ and Halo-H2B, biological replicates for the remaining conditions). (F) Average MSD versus lag time for WT and Halo-GAF mutants at 500-ms frame rate. Mean and SE (shaded) are shown. System noise is shown by the MSD of dye molecules stuck on coverglass. (G) Mean fluorescence recovery curves from FRAP experiments for Halo-GAF WT and mutants in hemocytes labeled with 50 nM JF552. Shaded areas represent SE. (H) Half recovery times of FRAP experiments.