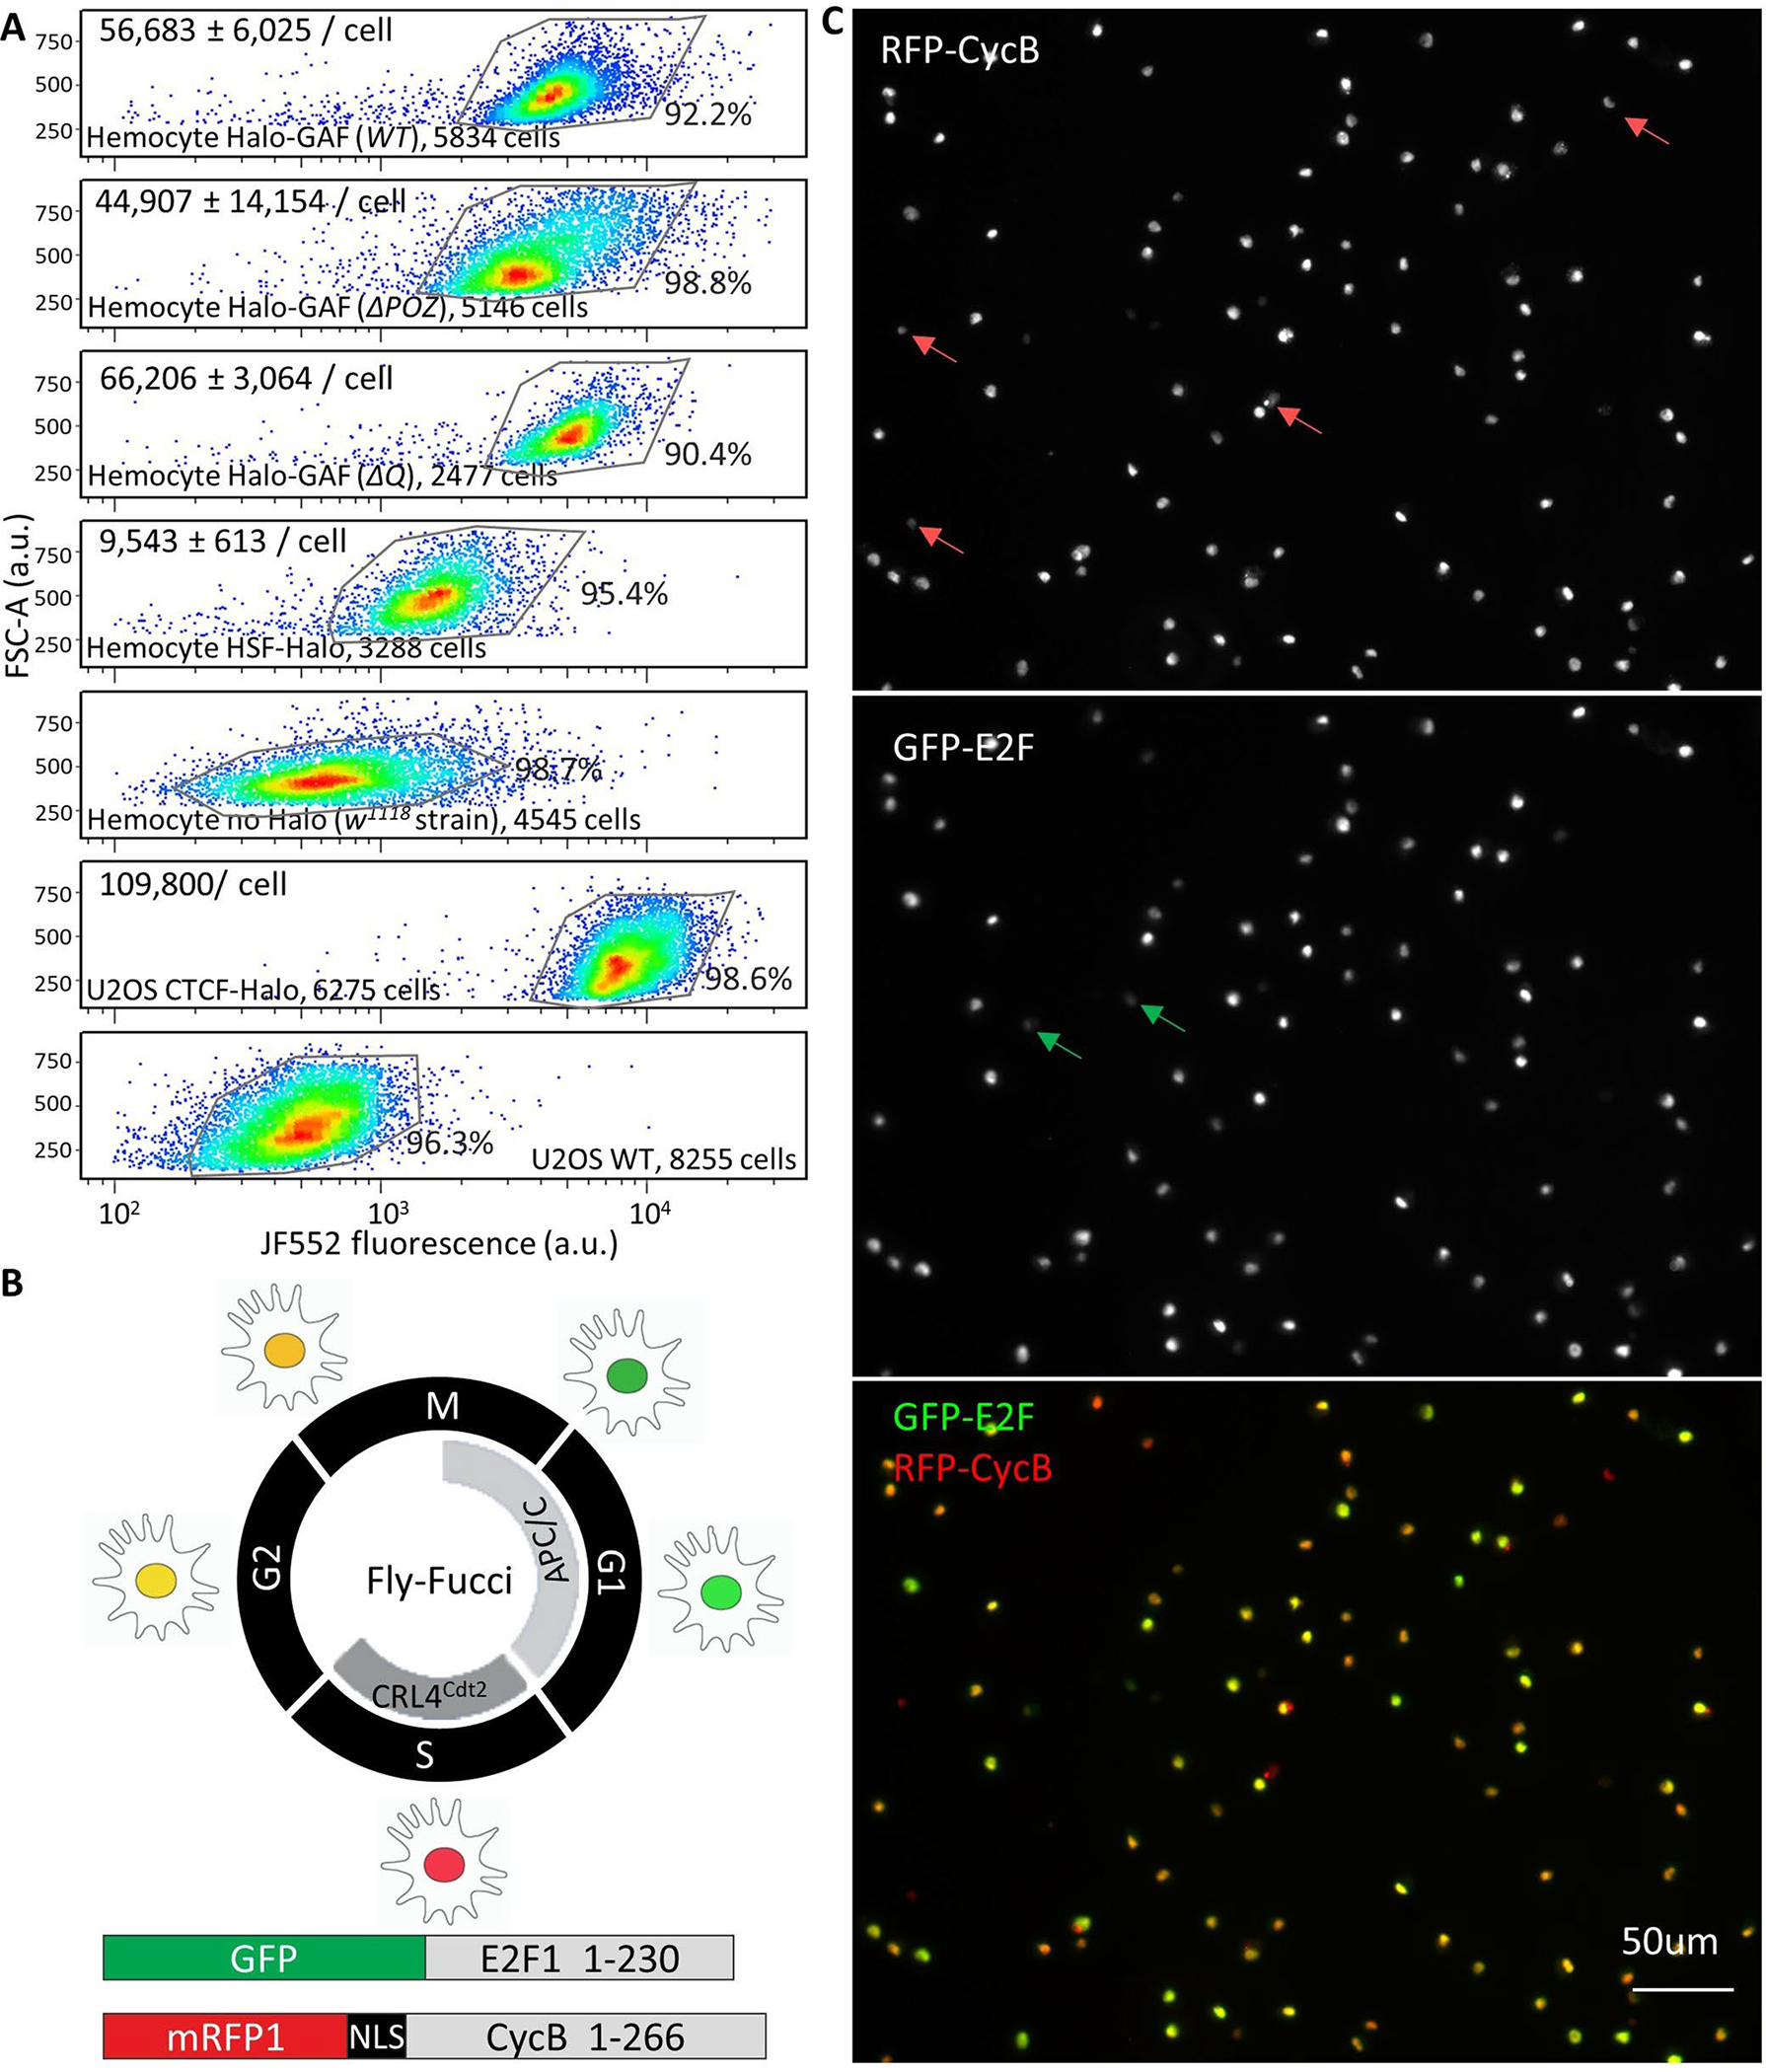
Extended Data Fig. 10 |. FACS quantitation of Halo-GAF and HSF-Halo in Drosophila hemocytes and cell cycle phase identification.

(A) Total Halo-GAF (knock-in WT, ΔPOZ and ΔQ) and HSF-Halo (transgenic in the P{PZ}Hsf03091/Hsf3 background) fluorescence per cell for JF552-stained late 3rd instar larval hemocytes and CTCT-Halo in U2OS cells quantified by flow cytometry. Cellular abundance of Halo-GAF and HSF-Halo molecules are estimated using CTCF-Halo in U2OS cells as a standard (see methods)87,119. Hemocytes (w1118 strain) or U2OS cells not expressing HaloTag were used as controls for background subtraction. One of three representative flow cytometry experiments is shown. Mean ± SD of estimated protein abundance is shown at the upper left corner of each plot. A much larger number of molecules (in the order of one million) for GAF was reported earlier in the S2 cell line125; the reason for the discrepancy is unclear. FSC-A, forward scatter area. (B) Conceptual diagram of the Fly-FUCCI system126. Both GFP-E2F11–230 and mRFP1-CycB1–266 are expressed with the GAL4/UAS system. In early M phase, both GFP-E2F11–230 and mRFP1-CycB1–266 are present and thus display yellow. In mid-mitosis, the APC/C marks mRFP1-CycB1–266 for proteasomal degradation, leaving the cells fluorescing green. As cells progress from G1 to S phase, CRL4Cdt2 degrades GFP-E2F11–230, and cells are labeled red due to the presence of mRFP1-CycB1–266 only. After cells enter G2 phase, GFP-E2F11–230 protein levels reaccumulate, marking the cells yellow due to the presence of mRFP1-CycB1–266. (C) Characterization of cell-cycle stage for late 3rd instar larval hemocytes. Only 4 out of 96 cells in the field of view show ‘red only’ fluorescence (S phase), and 2 cells have ‘green only’ fluorescence (M to G1 phase). The majority of hemocytes have both red and green fluorescence, indicating G2 phase or early M phase. Given that a previous study shows only 0.32% of larval hemocytes stain positive with the mitotic phosH3 antibody127, we conclude that most larval hemocytes are in the G2 phase.
