
Fig. 5 |. High site occupancy and remodeler autonomy quantifies pioneering criteria.
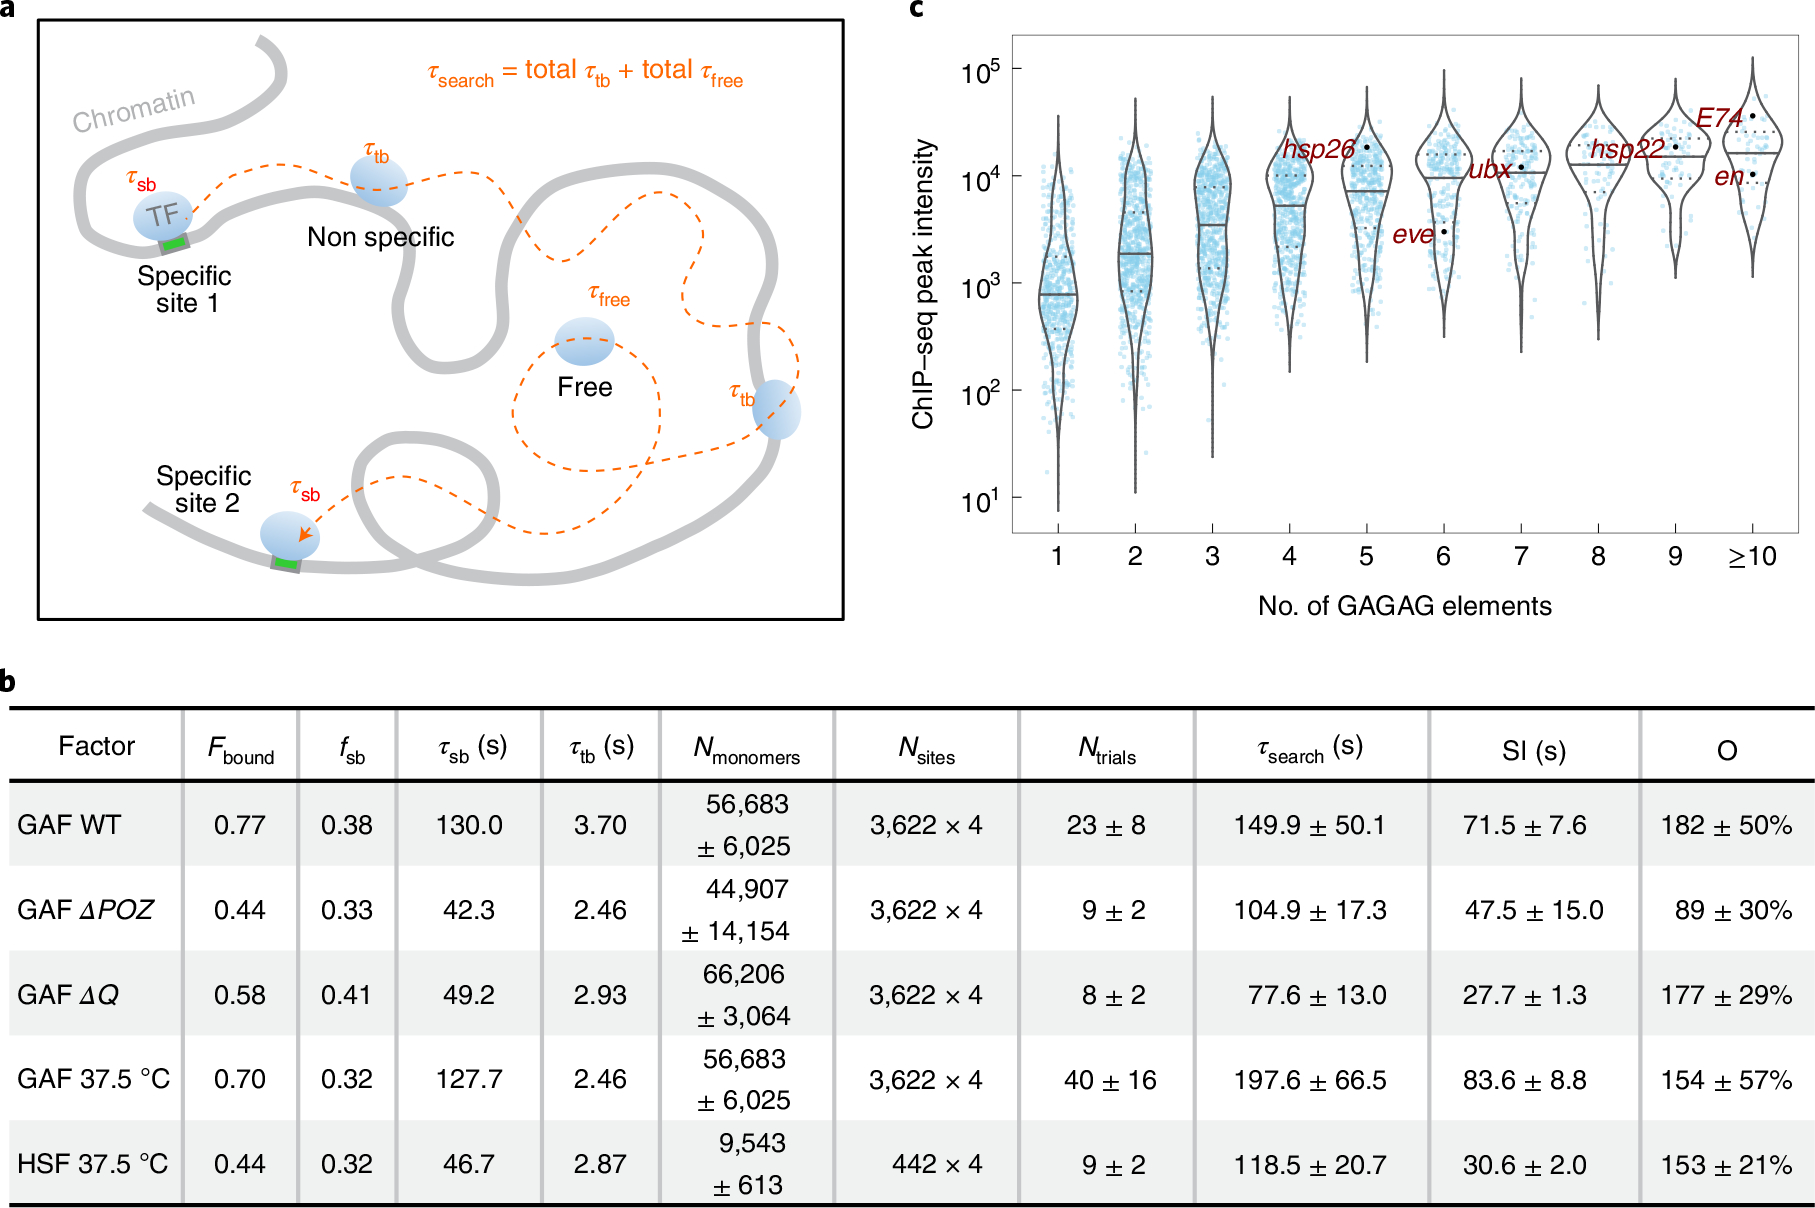
a, Schematic of a TF trajectory between two specific chromatin targets showing the search time , stable and transient dwell times, and . The TF molecule dissociates from a specific target, and samples nonspecific sites for a number of trials before encountering the next specific target. The equation is indicated (Methods). b, Key SPT and parameters measured in this study and from the literature17,54 are used to calculate occupancy levels for GAF and HSF. c, Violin plots of GAF ChIP-seq peak intensities (analysis of table s3 from Fuda et al.)17 in hemocyte-like S2 cells plotted by the number of nonoverlapping GAGAG elements between the start and end coordinates of each peak identified with HOMER108.