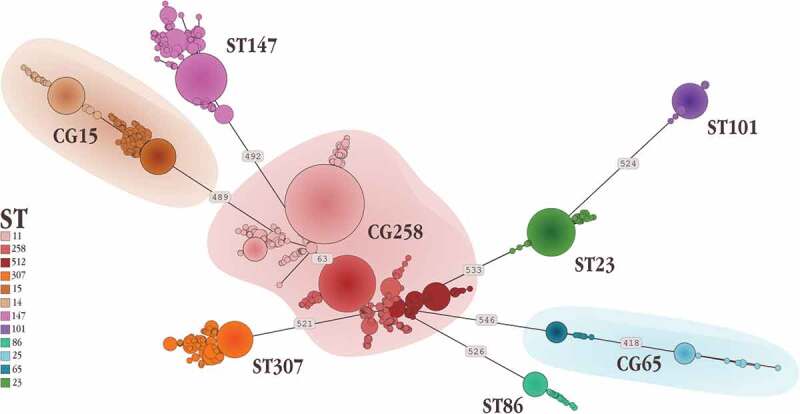
Figure 2.

Minimum spanning tree representing one of the potentially many relationship which link the isolates belonging to the different high-risk clones. Numbers on the branches indicate the Single Nucleotide Polymorphisms differentiating the connected Sequence Types.
