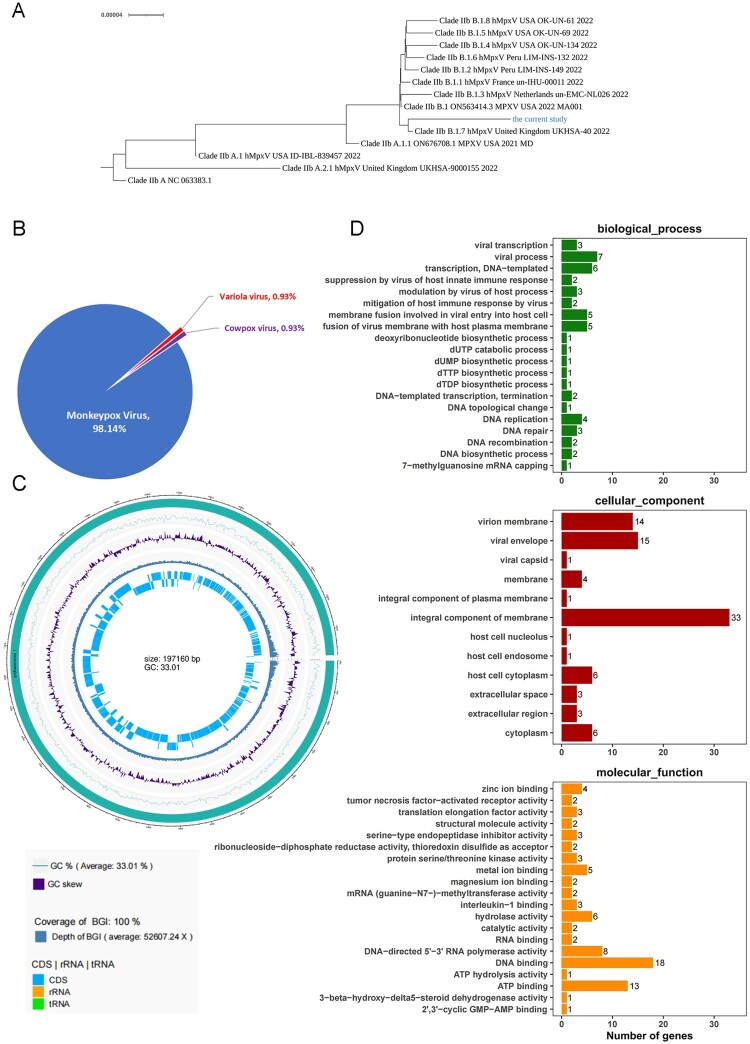
Figure 2.
Sequence analysis of WIBP-MPXV-001 isolated in Vero E6 cells. (A) Phylogenetic tree of WIBP-MPXV-001. (B) NR species distribution map of WIBP-MPXV-001. (C) Genome circle map of WIBP-MPXV-001. From the outside to the inside, the first circle is genome sequence, the second and third circle are G:C content and GC skew curve respectively, the fourth circle is sequencing depth and coverage information, and the fifth circle shows CDS and non-coding regions. (D) Go analysis of WIBP-MPXV-001.

