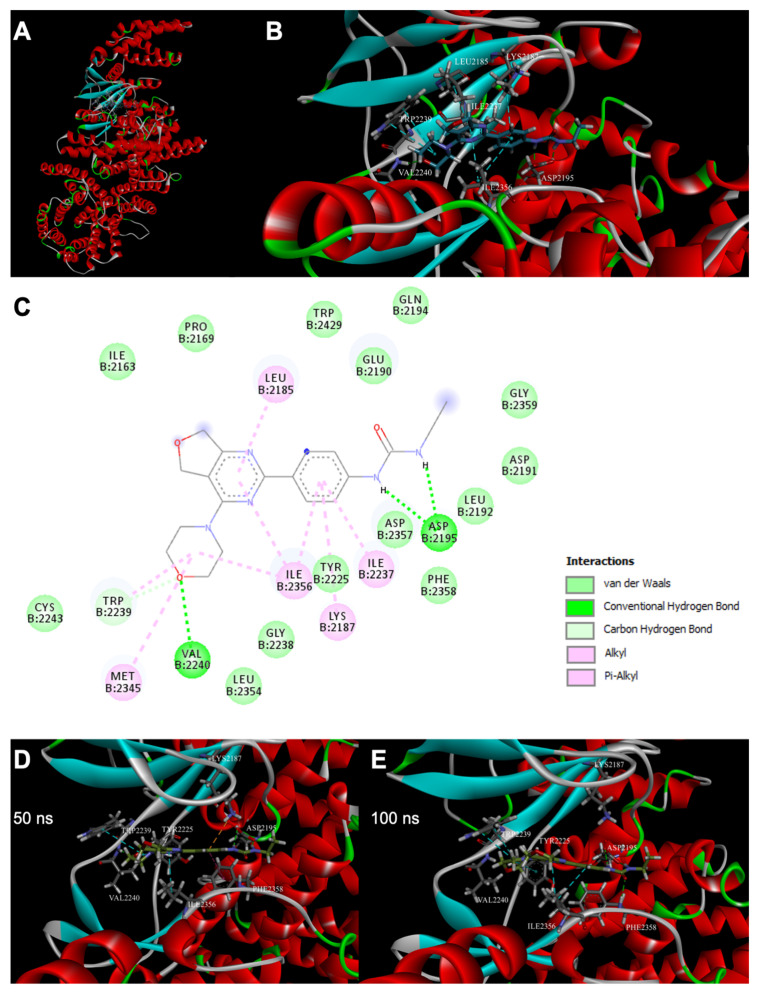
Figure 2.
Molecular docking of mTOR with TKA001. (A) Global view of mTOR kinase (PDB ID:4JT6) with docked TKA001 ligand in the ATP-binding site. (B) Detailed view of mTOR-TKA001 complex centered on the mTOR catalytic cleft obtained by molecular docking. Stick representation of TKA001 (C, dark grey; O, red; N, blue; and H, light grey) and of mTOR residues that took part in interactions. Green dash lines indicated hydrogen bonds, cyan dash lines—Pi–Alkyl contacts. (C) mTOR-TKA001 interactions on a 2D diagram. Several types of interaction were shown by color with different amino acid residues. (D,E) The snapshots of the ligand–protein complex from the 100 ns molecular dynamics simulation. Shown at 50 ns (D) and at 100 ns (E). Stick representation of TKA001 (C, dark grey; O, red; N, blue; H, light grey) and of mTOR residues that took part in interactions. Green dash lines indicated hydrogen bonds, cyan dash lines—Pi–Alkyl contacts, orange dash lines—Pi–Cation contacts, magenta dash lines—Pi–Pi contacts.

