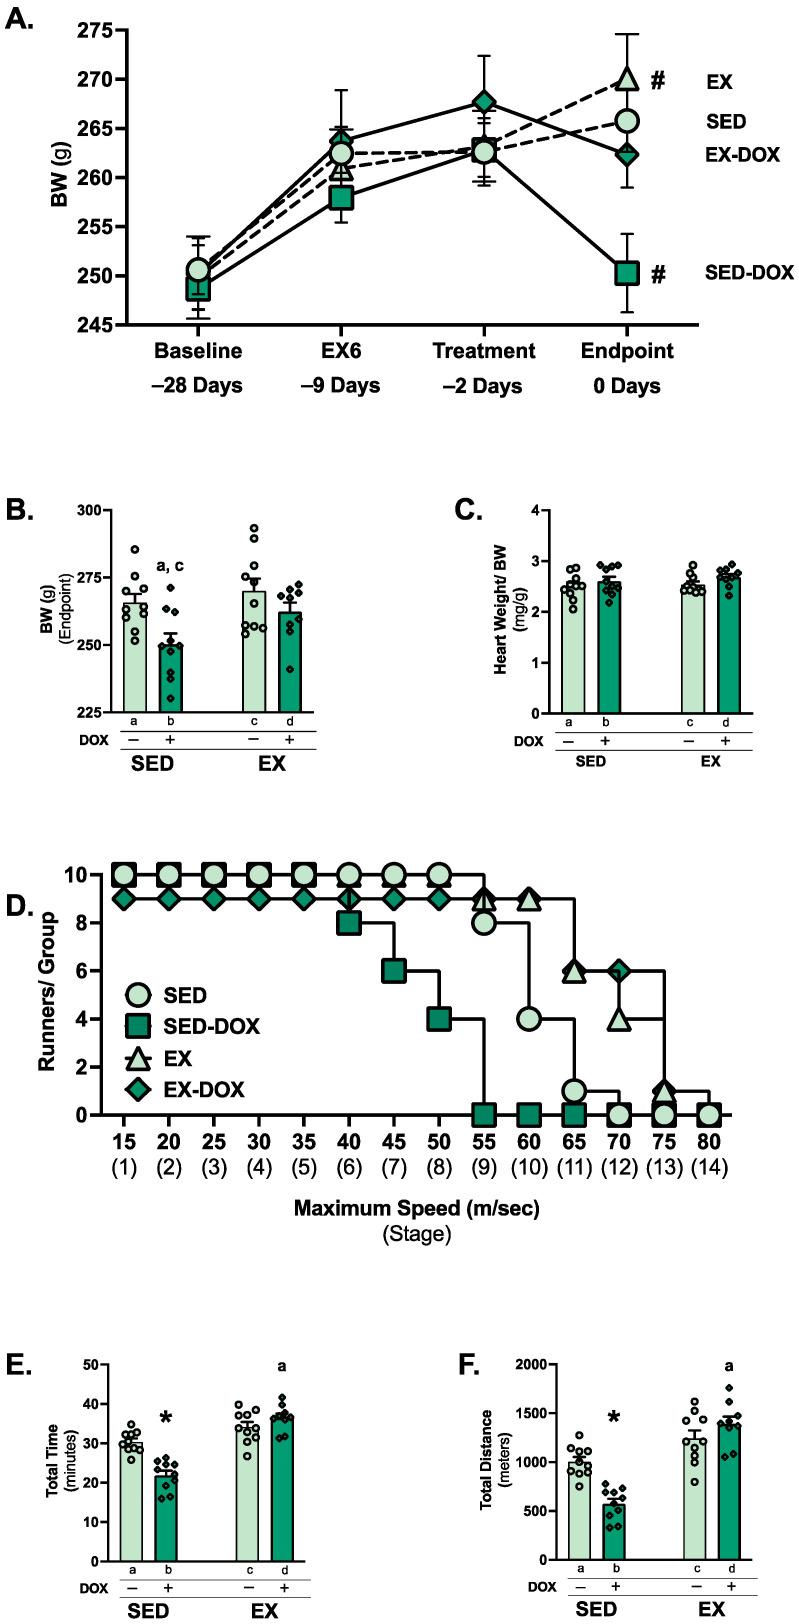
Figure 1.
Animal characteristics and exercise tolerance test: body weight change over the experimental period (A), body weight at endpoint (B), and heart weight normalized to body weight at endpoint (C). Comparison of stages completed for the exercise tolerance test (ETT) (D), ETT total time ran (E), and ETT total distance ran (F). Values are reported as mean ± SEM. Significant differences are indicated by symbols and individual letters (a–d) located above relevant groups (p < 0.05). # = endpoint significantly different versus treatment (p < 0.05). * = significantly different versus all groups (p < 0.05). a = significantly different versus SED (p < 0.05). c = significantly different versus EX (p < 0.05).

