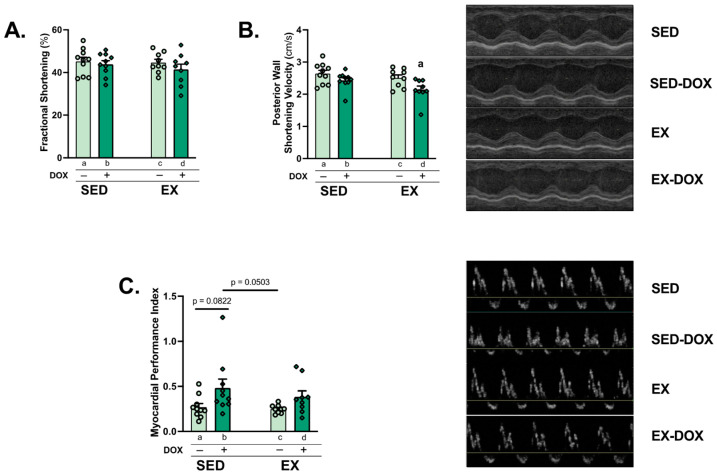
Figure 2.
Cardiac performance: M-Mode and Doppler echocardiography were performed to evaluate fractional shortening (A), posterior wall shortening velocity (B), and myocardial performance index (C). Representative images are shown to the right of the graphs. Values are reported as mean ± SEM. Significant differences are indicated by individual letters (a–d) located above relevant groups (p < 0.05). a = significantly different versus SED (p < 0.05).

