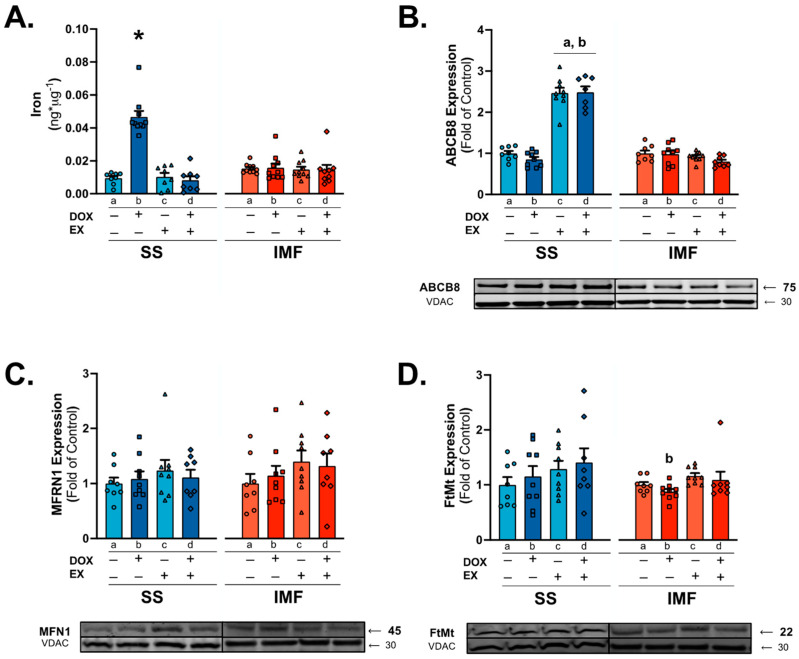
Figure 5.
Mitochondrial iron quantification & signaling: concentration of iron (A) in SS and IMF mitochondria. Western blots were performed for protein expression of ATP-binding cassette subfamily B member 8 (ABCB8; (B)), mitoferrin-1 (MFRN1; (C)), and mitochondrial ferritin (FtMt; (D)). Values are reported as mean ± SEM. Significant differences are indicated by symbols and individual letters (a–d) located above relevant groups (p < 0.05). * = significantly different versus all groups (p < 0.05). a = significantly different versus SED (p < 0.05). b = significantly different versus SED-DOX (p < 0.05).

