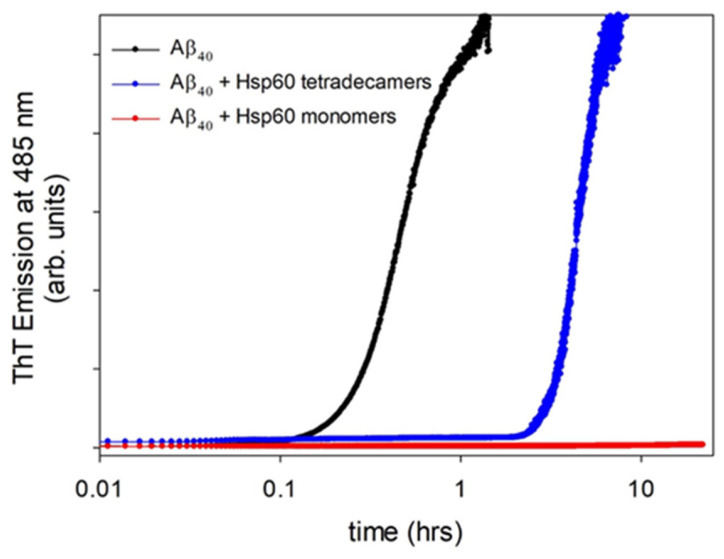
Figure 1.
Time course of ThT fluorescence emission at 37 °C, for a sheared sample of 50 μM of Aβ40 peptide alone (black line) and with the addition of 2 μM of Hsp60 in oligomeric (blue line) or monomeric (red line) form. The wavelengths of emission and excitation were 485 and 450 nm, respectively. ThT concentration was 12 μM.

