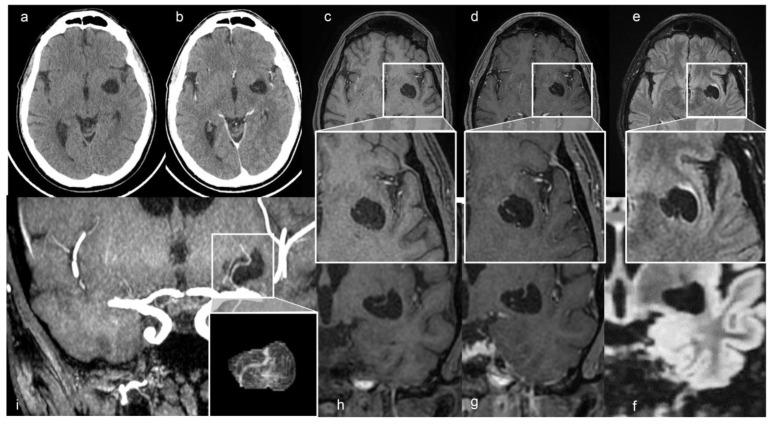
Figure 1.
(a) Axial non-contrast and (b) enhanced CT scan shows a left cystic-like intraparenchymal area, hisodense to CSF, suggestive of a GTPVS; in (b) note linear enhancing feature inside the cyst. Axial T1, T1 with gadolinium and FLAIR MRI sequences, (c–e) and magnified views; coronal T1, T1 with gadolinium and FLAIR MRI sequences (f–h) of GTPVS. Note in (e) the thin T2 hyperintensity surrounding the GTPVS, responsible for mild compression of neighboring parenchyma. (i) Coronal maximum intensity projection (MiP) TOF arterial 3D surfaces reconstruction of the GTPVS.

