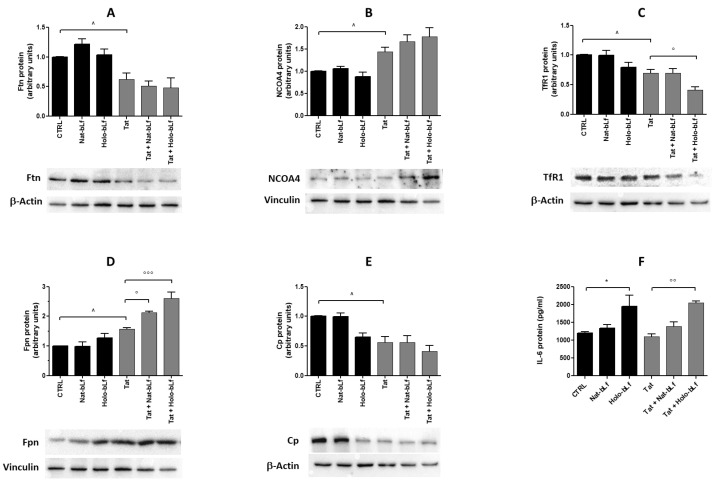
Figure 5.
Western blot and densitometric analysis of Ftn (A), NCOA4 (B), TfR1 (C), Fpn (D), Cp (E), and ELISA quantification of IL-6 (F) in U373 and U373-Tat cells treated with 100 μg/mL of Nat-bLf or Holo-bLf for 48 h. Data are calculated relative to the internal housekeeping gene (β-Actin or Vinculin) and are expressed as the means ± SEM. One-way ANOVA, followed by Tukey’s test, was used to determine significant differences. * p ≤ 0.05 vs. CTRL; ° p ≤ 0.05, °° p ≤ 0.01 and °°° p ≤ 0.001 vs. Tat; ^ p ≤ 0.05 between Tat and CTRL.

