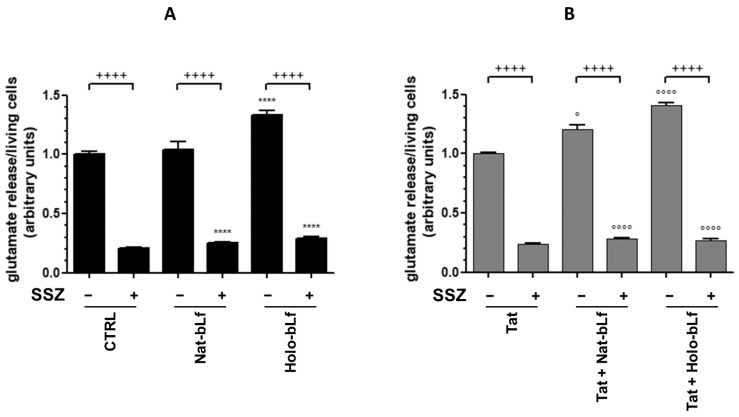
Figure 10.
Measurement of glutamate release in co-culture supernatants of SH-SY5Y with U373 (A) or U373-Tat (B) cells untreated or treated with 300 μM sulfasalazine and 100 μg/mL Nat- or Holo-bLf for 24 h. One-way ANOVA, followed by Tukey’s test, was used to determine significant differences. **** p ≤ 0.0001 vs. CTRL; ° p ≤ 0.05 and °°°° p ≤ 0.0001 vs. Tat; ++++ p ≤ 0.0001 between treatment with or without SSZ.

