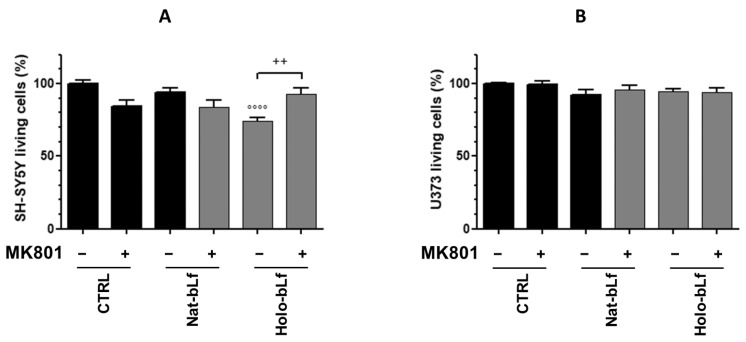
Figure 11.
Cell viability measurement by MTT assay on SH-SY5Y cells (A) and U373-Tat cells (B) in co-cultures, untreated or treated with 10 μM MK801 and 100 μg/mL Nat- or Holo-bLf for 24 h. The histograms show the percentage of living cells, and the rate of reduction was calculated by setting the control (CTRL) equal to 100%. One-way ANOVA, followed by Tukey’s test, was used to determine significant differences. °°°° p ≤ 0.0001 vs. CTRL; ++ p ≤ 0.01 between treatment with or without MK801.

