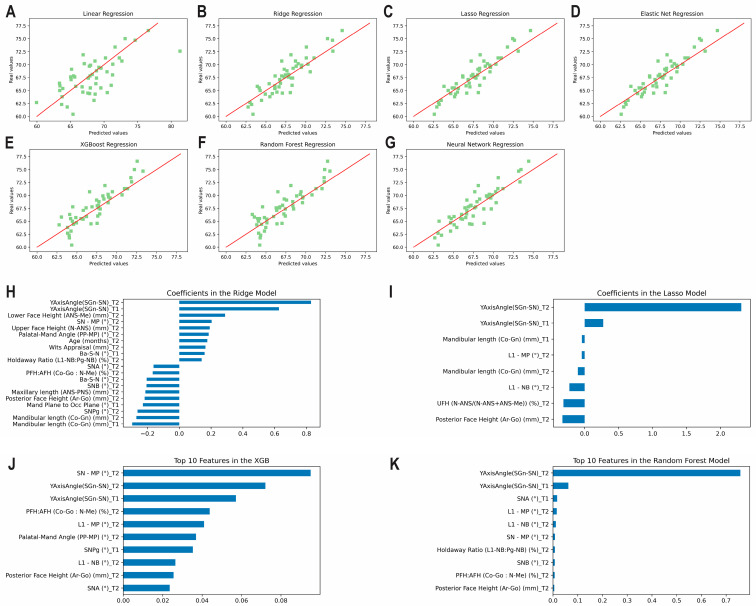
Figure 4.
Predicting the Y axis of growth at T3 using predictors from T1 and T2 together. Scatter plots for the predicted and actual values with lines of best fit for the: (A) Least Squares (linear); (B) Ridge; (C) Lasso; (D) Elastic Net; (E) XGBoost; (F) Random Forest; (G) Neural Network models. Top correlating coefficients for the (H) Ridge model; (I) Lasso model; (J) XGBoost model; (K) Random Forest model.

