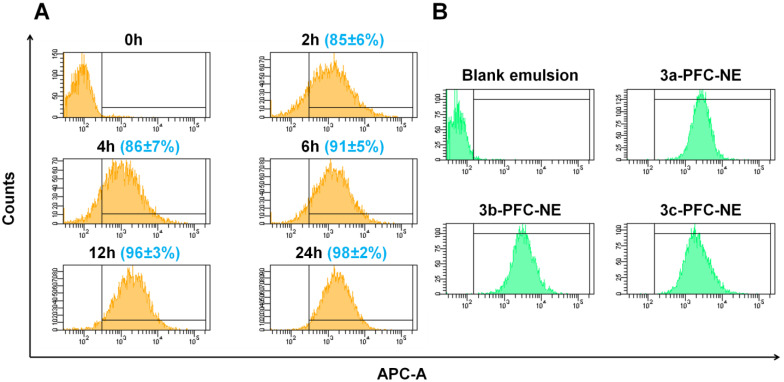
Figure 6.
FC-PFC-NE accumulation in HCT116 cells determined by flow cytometry. (A), Time course of cell-associated fluorescence after loading with 3b-PFC-NE. Percentages of positive (drug accumulated) cells are given in parentheses as mean ± SD. (B), 3a-c-PFC-NE uptake at 24 h. Shown are representative experiments (n = 3).

