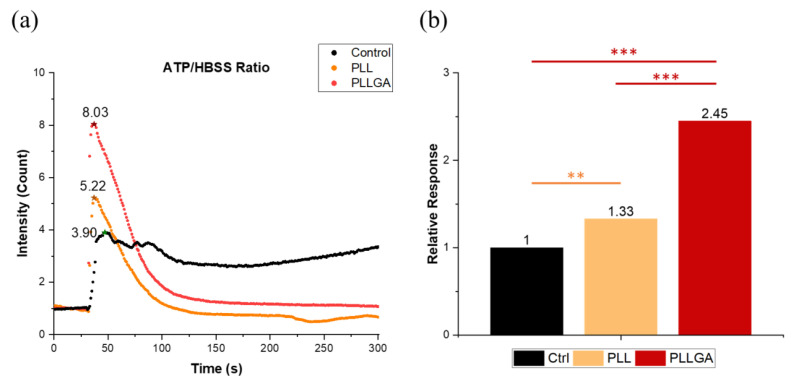
Figure 6.
(a) The fluorescent intensity profile of the calcium indicator to ATP stimulation and (b) the electroactivity of ARPE cultured on 2C-6.25PLL and 2C-PLLGA on Day 1 was represented as the response peak heights which were normalized with the control group. n = 7. The Kruskal–Wallis H-test was used to determine significant differences between groups. (** = p < 0.01, *** = p < 0.001). The star sign marks the highest point of each curve.

