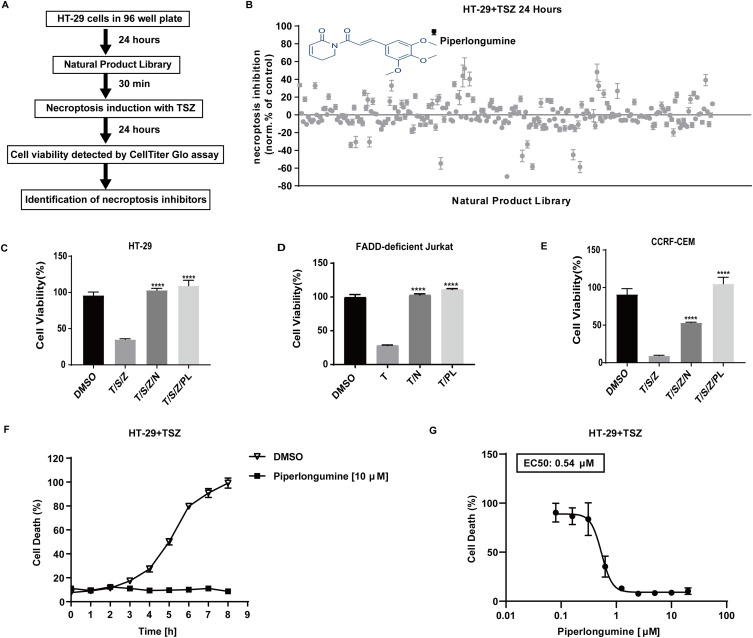
Figure 1.
In cellular drug screening identifies piperlongumine as a necroptosis inhibitor. (A) Workflow diagram for a drug screen. (B) Inhibition values were calculated for different drugs on HT-29 cells (DMSO=0, Nec-1 (25 µM) =100) treated with SM164 (200 nM) and z-VAD-fmk (20 µM) followed by hTNFα (20 ng/mL). Values represent mean value± S.D. for 256 drugs assayed at 10 μM in duplicates, respectively. See Supplementary Table 1 for raw cell viability data of drug screen. For viability tests, (C) HT-29 cells (D) FADD-deficient Jurkat cells (E) CCRF-CEM cells were pretreated with piperlongumine (10 µM) plus SZ for 30 min, and then stimulated with hTNFα for 24 h to induce necroptosis (DMSO = 100). ATP (Cell Titer Glo) was used as a luminescence-based cell viability assay throughout the experiment. ****P < 0.0001, a significant difference was shown between the TSZ-induced cells and the drug pretreated cells. (F) HT-29 cells were pretreated with PL (10 μM) in the presence of SM-164 (200 nM) and z-VAD-fmk (20 μM) for 30 min followed by human TNF-α (20 ng/mL) for 8h to induce necroptosis. Dead cells were monitored in the presence of the cell membrane impermeable SYTOX Green (2.5 μM). The fluorescence was evaluated every 1 h from each cell. Triton X 100 (0.1%) for 3 h as maximal fluorescence intensities were taken as 100% dead cells. Data are represented as a percentage of dead cells after normalization to total cell number for each group. (G) Cell death was assessed using sytox green by dose-dependent protection of piperlongumine (0.1 µM-20 µM) against TSZ-induced necroptosis in HT-29 cells for 24 h.

