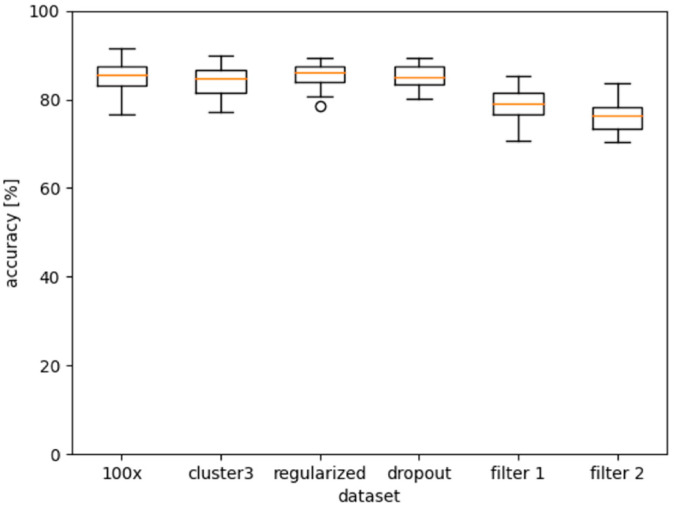
Figure 6.
Further tests on the “0, rest’” dataset. The first plot from the left shows a 100-fold cross-validation. The second was performed on the largest cluster originating from spectral clustering. The third boxplot had a regularization factor of 1 × 10⁻⁵ defined. The fourth used a dropout probability of 0.2. For the fifth and sixth, we performed fluorescence filtering as defined in [13].

