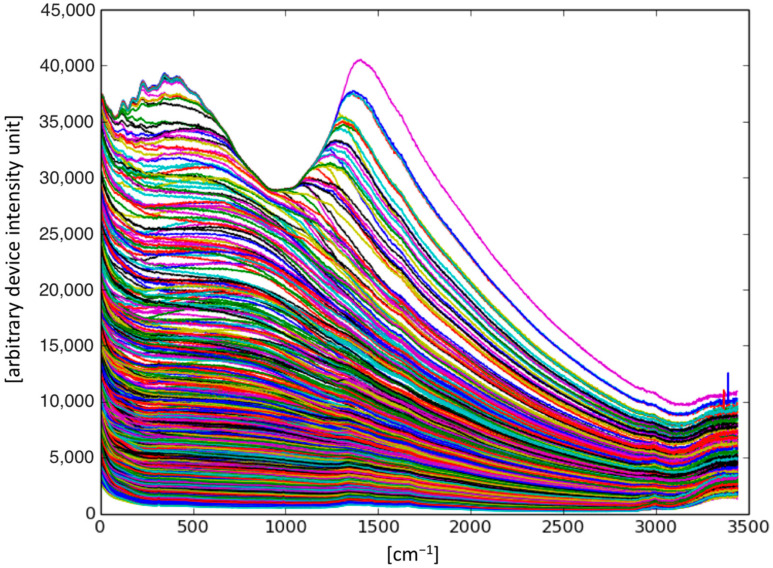
Figure 7.
Overview of spectral data used in this study. The best learning performance was obtained with raw data, regardless of the massive background. The curves plot intensity (y-axis in arbitrary device-dependent units) against spatial frequency (x-axis in wavenumbers). Colors are random, for visual distinction only.

