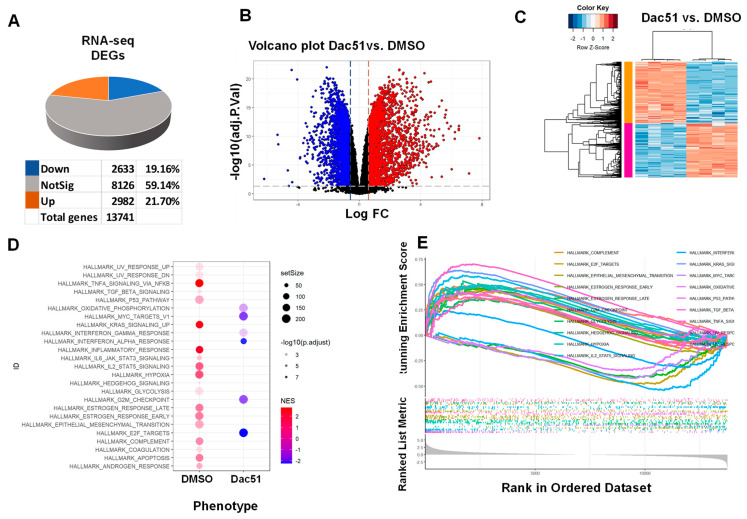
Figure 4.
Treatment with Dac51 sculpts the transcriptome of uLMS cells. (A) Dac51-induced DEGs. DEGs were identified by voom + Limma at adjusted p-value cut off 0.05 and −1.5 > log2FC > 1.5; (B) volcano plots of the gene expression profiles of Dac51 vs. control; (C) heatmap; Pearson correlation was used to cluster DEG (Dac51 vs. control), which were then represented as a heatmap with the data scaled by Z score for each row; (D) hallmark analysis demonstrated the alteration of multiple pathways in SK-UT-1 cells in response to Dac51 treatment; (E) GSEA for comparison using the hallmark MSigDB collection. DEGs: differentially expressed genes, FC: fold change.

