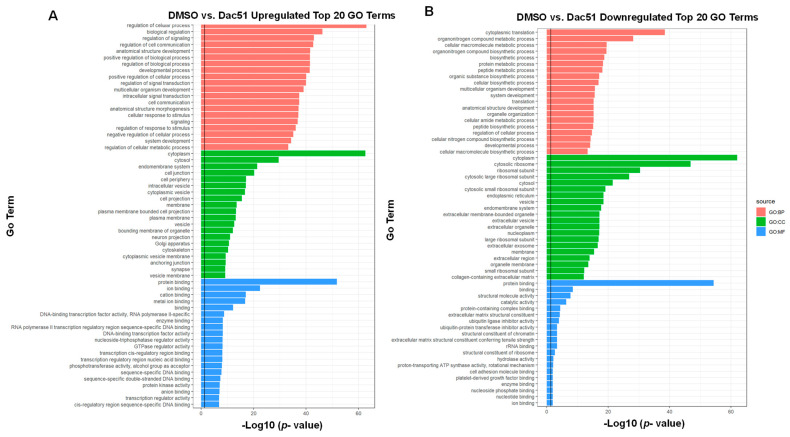
Figure 5.
The GO functional annotation and pathway enrichment analysis of DEGs between DMSO and DAC-51 groups: (A) Upregulated gene enrichment in GO. (B) Downregulated gene enrichment in GO. GO, Gene Ontology; BP, biological process; CC, cellular component; MF, molecular function. DEGs were identified by voom at adjusted p-value cut off 0.05 and −1.5 > log2FC > 1.5.

