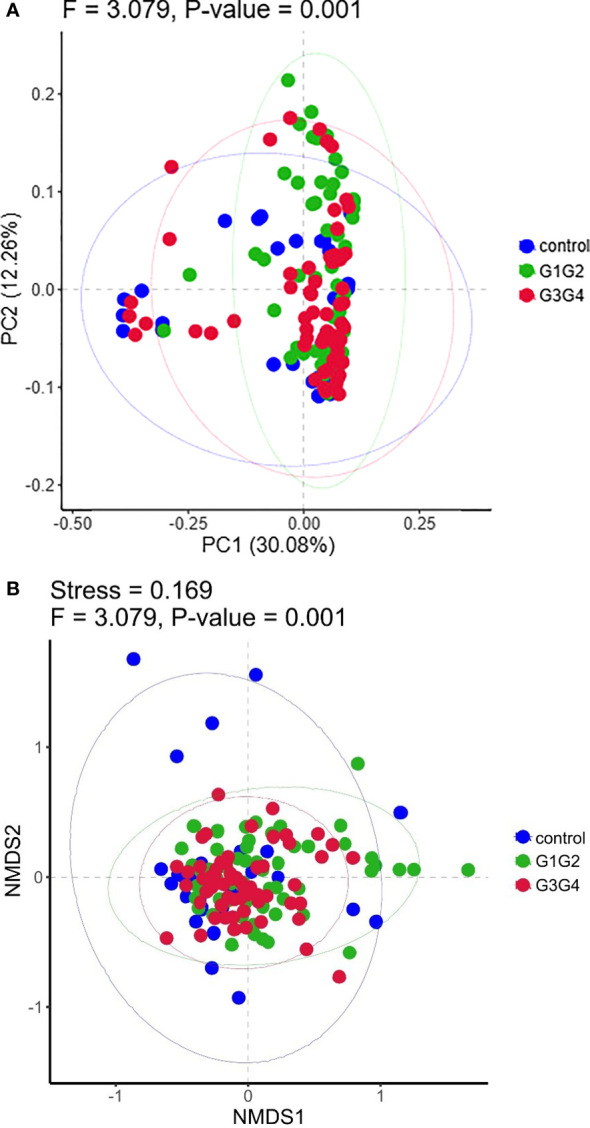
Figure 2.

(A) Principal Coordinates Analysis (PCoA) plot based on Bray-Curtis distance. Each dot represents one sample from each group and samples from the same group are represented using the same color. (B) The non-metric multidimensional scaling (NMDS) analysis was used to compare the differences between the groups in the sample. Each dot represents one sample from each group, the distance between dot indicates the degree of variation and samples from the same group are represented using the same color.
