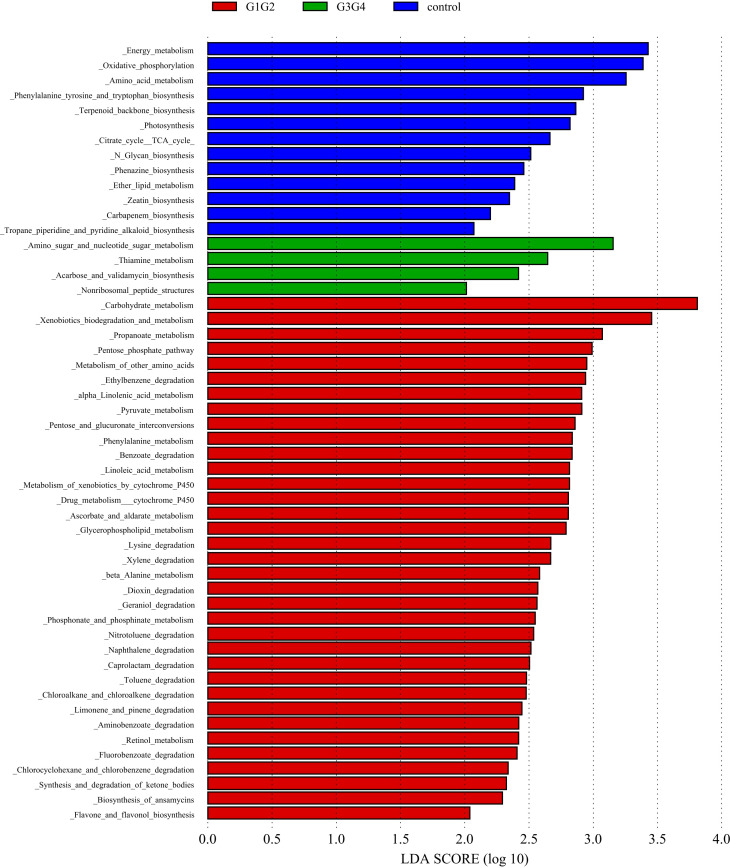
Figure 6.
Significant differences in relative abundance identified by LEfSe analysis between the three groups (Control, G1G2 and G3G4). In the metabolism function module (level 3), the untreated group(control) is shown in blue, the intensive treatment group(G1G2) in red and the consolidation treatment group(G3G4) in green. The length of the column represents the influence of significantly different species in relative abundance (LDA scores > 2).

