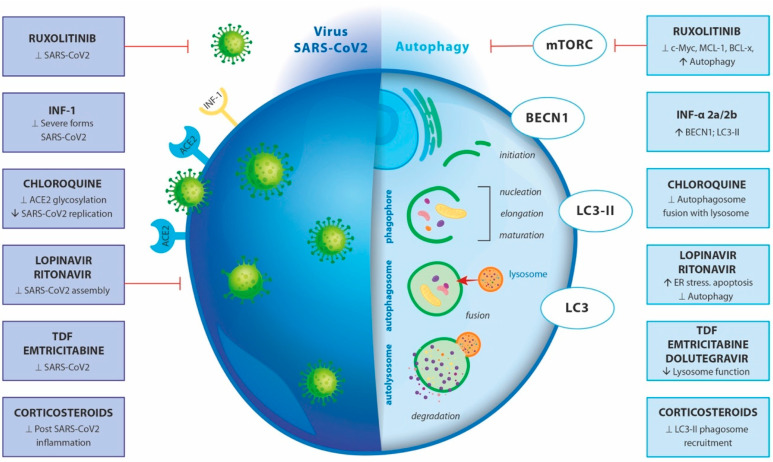
Figure 2.
Effect of different drugs on SARS-CoV-2 and autophagy. The left part of the figure presents SARS-CoV-2 entry and replication in an infected cell and the effect of the enlisted drugs; The right part represents the effect of the enlisted drugs on the autophagy machinery in the cell. ↑—indicates activation/enhancement; ⊥—indicates repression/inhibition, ↓—indicates deactivation/degeneration.

