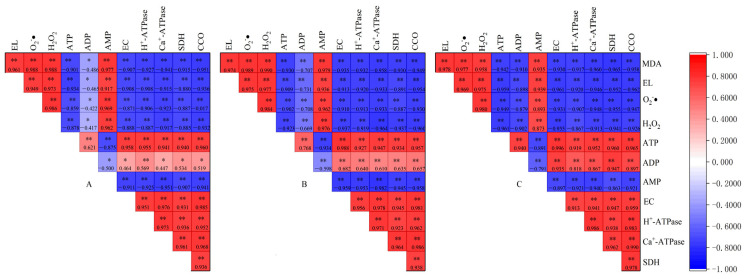
Figure 8.
Pearson’s correlation coeffcients (r) among the analysis of membrane lipid peroxidation and energy metabolism indexes of apple fruit under 5 ± 0.1 °C (A), 5 ± 1 °C (B) and 5 ± 5 °C (C) during storage. Positive (Red) and negative (blue) correlations between analyses of respective values at * p < 0.05, ** p < 0.01. Numbers in the boxes represented the correlation coefficients.

