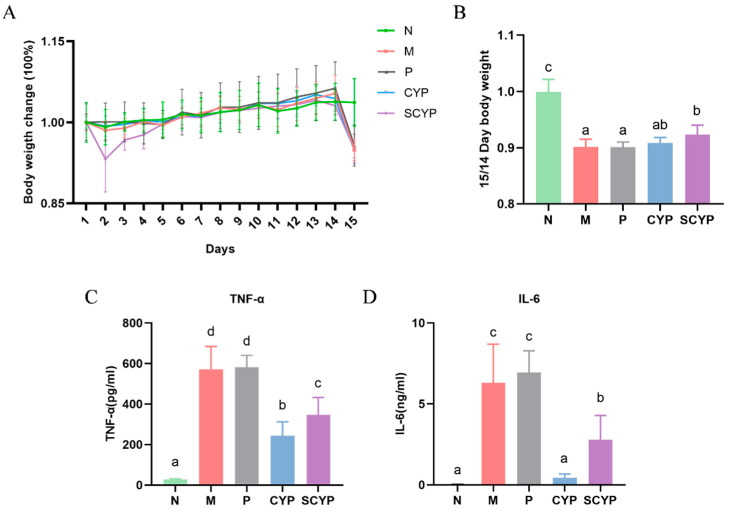
Figure 1.
Percentage change in body weight compared with day 1 for each group (A). Body weight ratio of day 14/15 for each group (B). Levels of pro-inflammatory cytokines TNF-α (C) and IL-6 (D) in the plasma. Values are expressed as means ± SD. (n = 6 for A,B and n = 5 for C,D). Different letters represent significant differences between different groups (p < 0.05).

