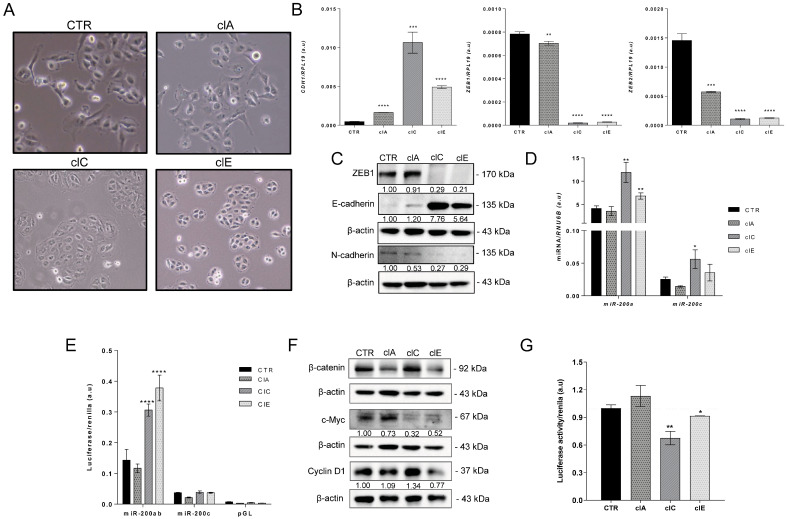
Figure 4.
CRISPR/Cas9-mediated EZH2 gene editing induces mesenchymal–epithelial transition (MET) in ATC cells. (A) Phase contrast images of SW1736-CTR and SW1736-ClA, ClC and ClE cells in culture showing distinct morphology. SW1736-CTR and SW176-ClA present mesenchymal-like phenotype, whereas SW1736-ClC and SW1736-ClE are more epithelial-like. Images were taken at 100× magnification. (B) Gene expression of epithelial gene CDH1 (E-cadherin) and mesenchymal transcription factors ZEB1 and ZEB2 in SW1736-ClA, SW1736-ClC and SW1736-ClE compared with SW1736-CTR. The expression was normalized using RPL19. Data are expressed as mean ± SD (n = 3) for gene expression. (C) Protein levels of ZEB1, E-cadherin and N-Cadherin by Western blot in the whole-cell lysate of SW1736-ClA, SW1736-ClC and SW1736-ClE compared to SW1736-CTR. (D) RT-qPCR gene expression of mature miR-200a (left) and miR-200c (right) in SW1736-ClA, SW1736-ClC and SW1736-ClE compared with SW1736-CTR. RNU6B was used as endogenous control. Data are expressed as mean ± SD for gene expression. (E) Activation of miR-200 promoter reporter luciferase in SW1736-edited cells compared to SW1736-CTR. (F) Protein levels of β-catenin, c-MYC and Cyclin D1 by Western blot in the whole-cell lysate of SW1736-ClA, SW1736-ClC and SW1736-ClE compared to SW1736-CTR. (G) Activation of Wnt/β-catenin signaling in SW1736-edited cells compared to SW1736-CTR using pM50 luciferase reporter that contains TCF/LEF binding sites. Luciferase activity was normalized using renilla activity. Data are expressed as mean ± SD (n = 4). a.u., arbitrary units; *, p < 0.05; **, p < 0.01; ***, p < 0.001; ****, p < 0.0001 vs. SW1736-CTR.

