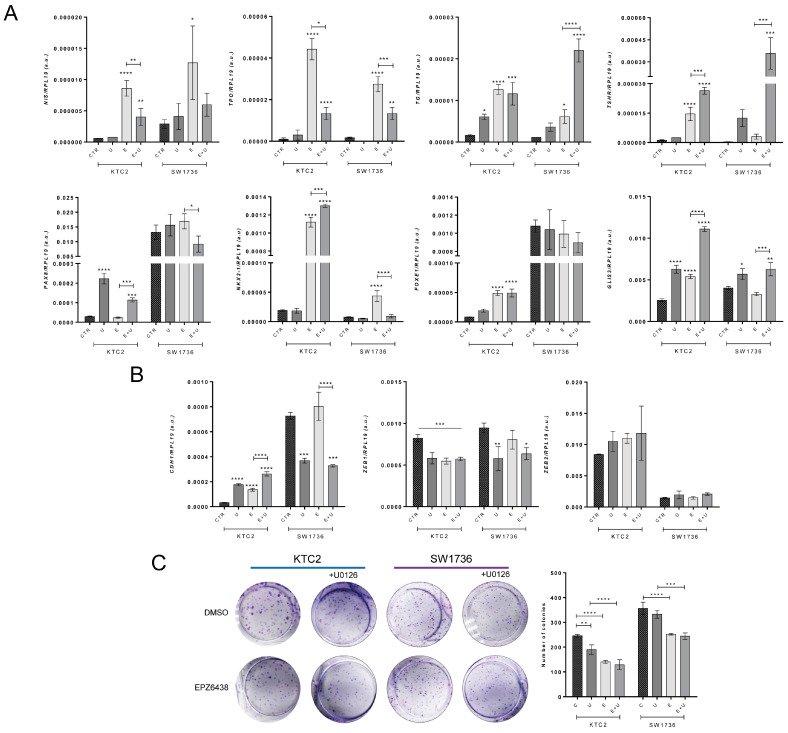
Figure 7.
Pharmacological blockage of EZH2 activity induces differentiation of ATC cells and reduces colony formation. KTC2 and SW1736 cells were treated with 5.0 µM of EPZ6438 alone (E) or in combination (E + U) with 10 µM of U0126 (U) compared with DMSO control (CTR). (A) Gene expression of thyroid-differentiation genes NIS, TPO, TG and TSHR; transcription factors PAX8, NKX2-1, FOXE1 and GLIS3. (B) Gene expression of epithelial gene CDH1 and mesenchymal genes ZEB1 and ZEB2. Data are expressed as mean ± SD (n = 3) for gene expression. (C) Colony formation assay of KTC2 and SW1736. Data are expressed as mean ± SD (n = 3) for total colony count. a.u., arbitrary units; *, p < 0.05; **, p < 0.01; ***, p < 0.001; ****, p < 0.0001 vs. DMSO.

