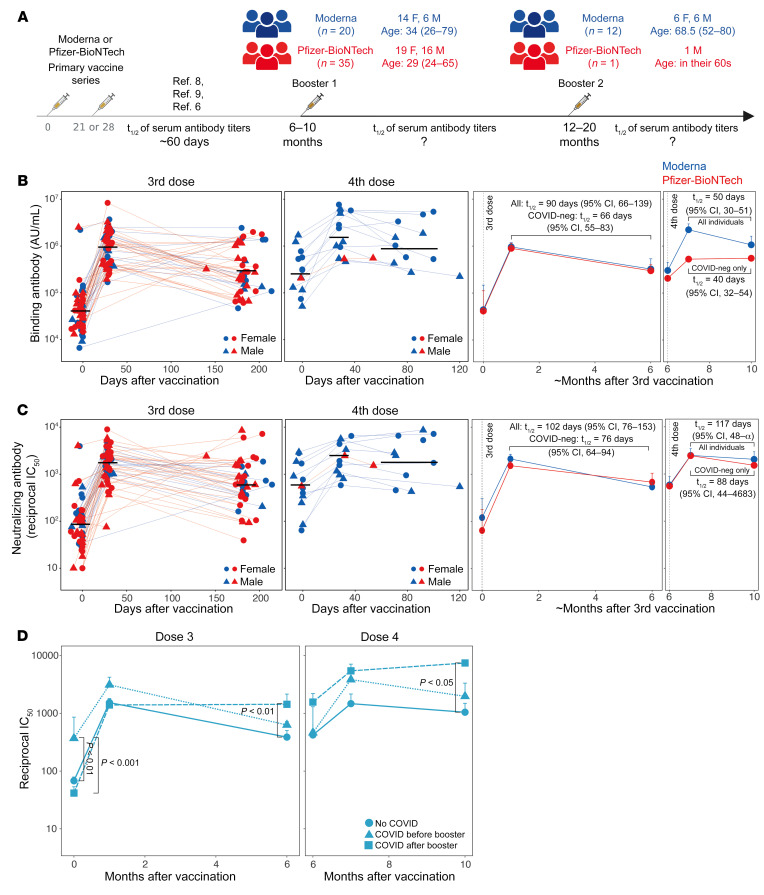
Figure 1. Serum antibody responses following mRNA booster vaccinations.
(A) Schematic of the study design and participants’ details. The schematic was made using BioRender. (B and C) Anti–spike-binding IgG (B) and live-virus nAb titers (C) against the ancestral WA.1 strain. Each symbol represents an individual in the 2 plots on the left (n = 55 and n = 13 for the 3- and 4-dose groups, respectively). The black horizontal lines indicate geometric mean titers. The 2 graphs on the right show a summary (geometric mean + SEM) of the antibody responses. (D) nAb titers in groups of participants stratified by exposure to COVID-19. Data shown are the geometric mean for each group + SEM. The statistical difference between groups at each time point was analyzed by the Mann-Whitney U test. F, female; M, male; neg, negative.

