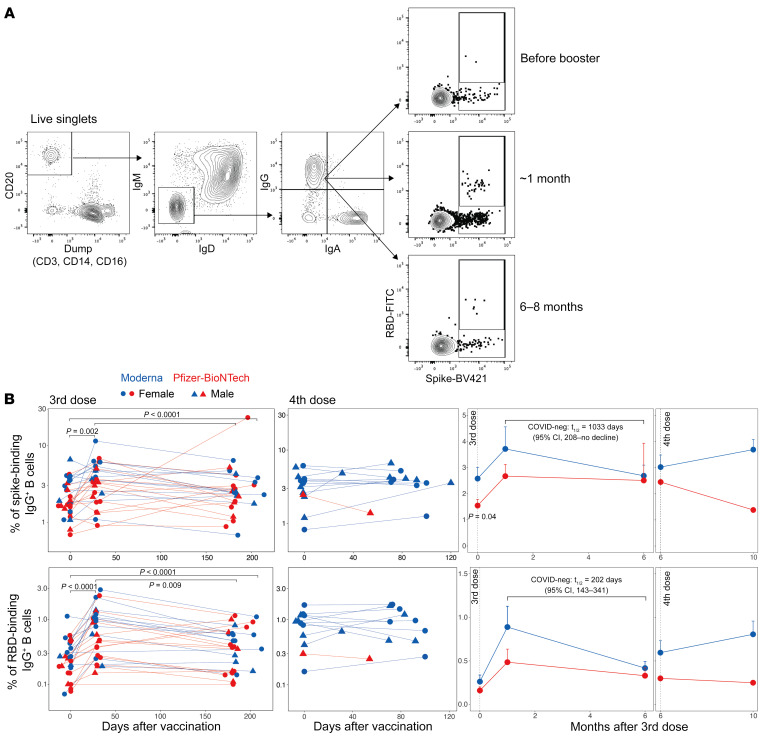
Figure 3. Memory B cell responses to the booster vaccination.
(A) Representative flow cytometry profile showing the gating strategy to define spike-specific B cell frequencies (gated as live CD20+IgD–IgM–spike+ RBD+/– cells. (B) Frequency of WA.1 spike–specific (top panel) or RBD-specific (bottom panel) memory B cells relative to CD20+IgD–IgM– B cells. Each symbol represents an individual (n = 28, after the third dose; n = 13, after the fourth dose). The statistical differences between time points were determined using the Wilcoxon matched-pairs, signed-rank test. The 2 graphs on the right show a summary of the responses (geometric mean + SEM). The statistical difference between the groups was determined using the Mann-Whitney U test.

