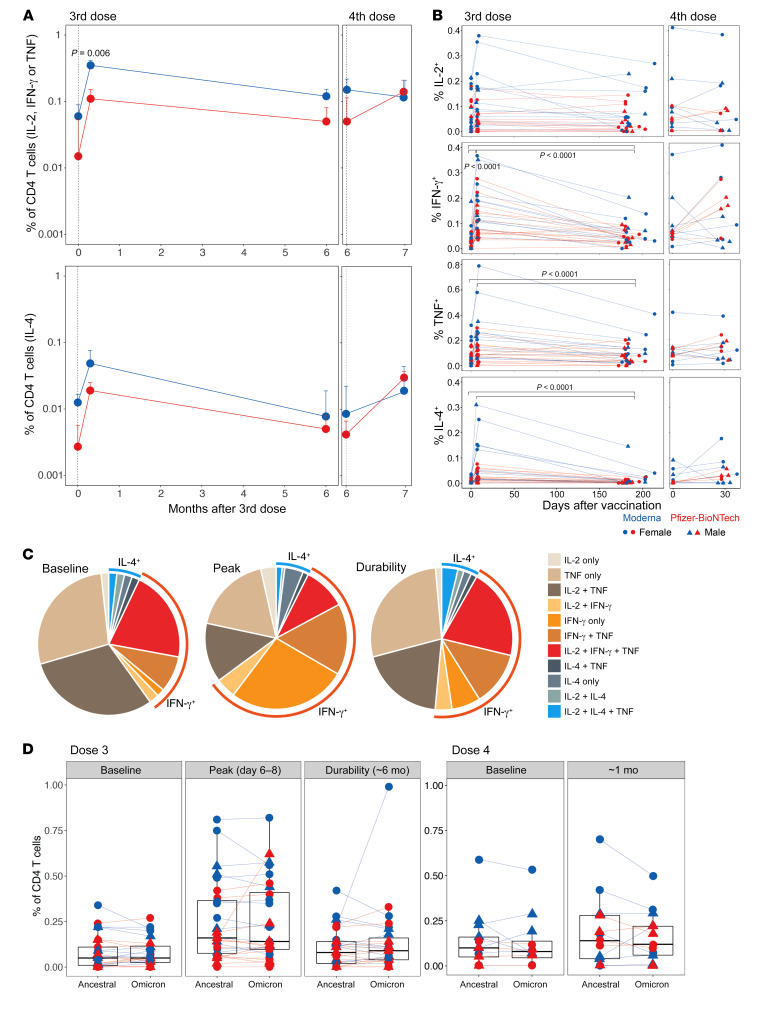
Figure 4. T cell responses induced by the mRNA booster vaccination.
(A) Summary of the frequency of ancestral spike–specific CD4+ T cells secreting IL-2, IFN-γ, or TNF (Th1-type, top panel) and IL-4 (Th2-type, bottom panel). Median responses ± SEM are plotted. The statistical difference between groups was determined using a Mann-Whitney U test. (B) Frequency of spike-specific CD4+ T cells that produced the indicated individual cytokines (geometric mean + SEM). Each symbol represents an individual (n = 28 after the third dose and 13 after the fourth dose). The statistical significance between time points was calculated using a Wilcoxon matched-pairs, signed-rank test. (C) Pie charts showing the proportion of spike-specific CD4+ T cells producing 1, 2, or 3 cytokines in response to the third dose of the vaccine. (D) Comparison of CD4+ T cell frequencies (Th1-type producing IL-2, TNF, or IFN-γ) between ancestral and Omicron BA.1 viral strains measured at the time points indicated on the plots.

