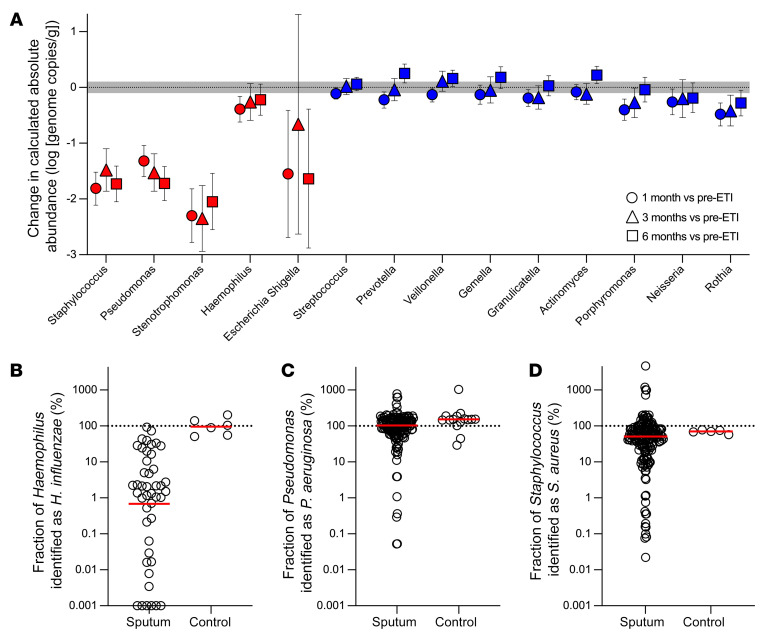
Figure 4. Sequence-based analyses find marked declines in the sputum density of traditional CF pathogens, but little change in other organisms.
(A) By-participant change in calculated absolute abundance after 1 (circles), 3 (triangles), and 6 (squares) months of ETI for genera detected at an average of 1% or greater in baseline sputum samples. Genera containing a traditional CF pathogen are indicated with red symbols, other bacterial genera are indicated in blue symbols. Mean and CIs as determined by mixed-model repeated measures analysis are shown. Both groups are ordered by the average cohort-wide relative abundance at baseline (high to low). Gray shading indicates technical variation in measurements of control samples (see Supplemental Figure 10C). See Supplemental Table 9 for number participants studied per time point and statistical analysis. (B–D) Proportion of Haemophilus (B), Pseudomonas (C), and Staphylococcus (D) genera abundance attributable to the corresponding CF pathogen species. The proportion of Haemophilus, Pseudomonas, and Staphylococcus genera genomes that are H. influenzae, P. aeruginosa, or S. aureus species, respectively, was calculated by dividing H. influenzae, P. aeruginosa, or S. aureus species genome abundance measured by species-specific ddPCR by the corresponding genera absolute abundance. Sputum from participants with prior evidence of H. influenzae, P. aeruginosa, or S. aureus (from patient registry data) were studied. “Controls” were replicate cultures of laboratory strains of the indicated species. Values for controls sometimes exceed 100% due to variations in measurements of genera absolute abundance (using the product of total 16S rRNA and genera relative abundance) and species absolute abundance (using species specific ddPCR data). The difference between Haemophilus genera and H. influenzae abundance was significant (P = 0.0014); differences between Pseudomonas and P. aeruginosa abundance (P = 0.09) and Staphylococcus and S. aureus abundance (P = 0.38) were not different by 2-tailed t test on log-transformed data.

