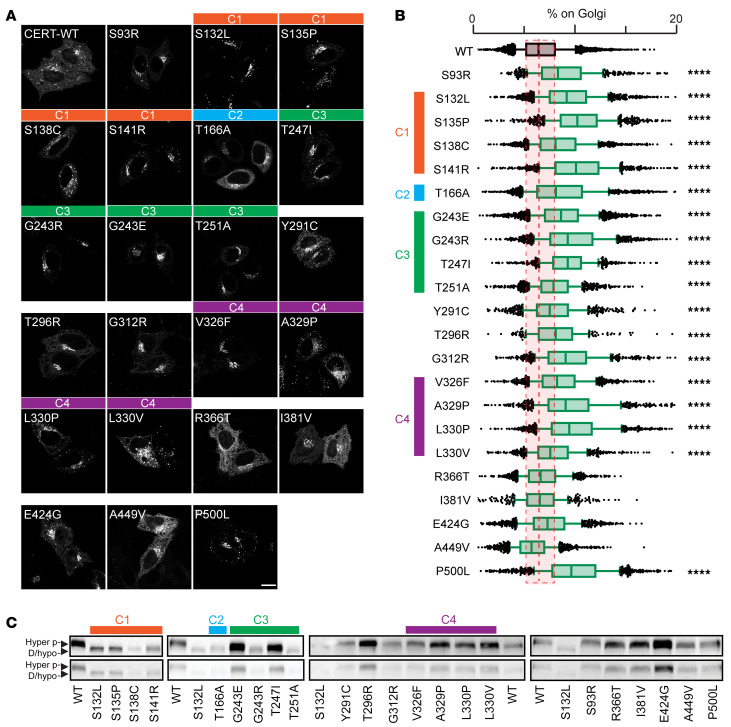
Figure 2. Disease-causing variants result in CERT misregulation.
(A) CERT-GFP WT and mutant localization in HeLa cells analyzed by confocal microscopy. Scale bar: 20 μm. (B) Percentage of CERT-GFP WT and mutants associated with the Golgi complex in HeLa cells. Cells were stained with Hoechst and anti-GM130 antibody and analyzed by automated fluorescence microscopy (n >1,000 cells per condition; ****P < 0.0001, 1-way ANOVA, effect size >15%). WT CERT is shown in gray, and CerTra mutants are shown in green. Data are shown as box-and-whisker plots. Bars represent the median value of each data set. (C) Western blot of HeLa cells expressing CERT-GFP WT or mutants (n = 3). Hyperphosphorylated (Hyper p-) and de-/hypophosphorylated (D/hypo-) bands are indicated by arrowheads. The clusters, as in Figure 1, are indicated throughout A–C.

