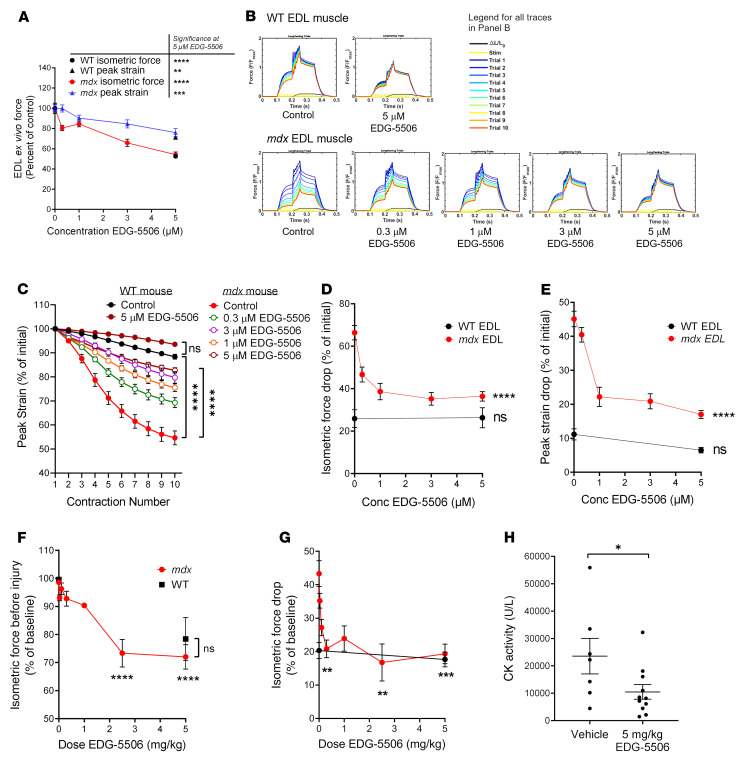
Figure 2. Strength loss during eccentric contraction of dystrophic muscle is dependent upon contraction via myosin.
(A–E) WT and mdx mouse EDL muscle force ex vivo (n = 5–14). (A) Change in isometric and peak strain as a function of EDG-5506 concentration. Change in isometric force (circles) is represented as a percentage of initial force after 1-hour incubation with EDG-5506. Significance was calculated from the comparison of 5 μM EDG-5506 versus control. Peak strain (triangles) is represented as a percentage of peak strain obtained with vehicle treatment derived from the first eccentric contraction. Definitions of these metrics are provided in Supplemental Figure 2A. (B) Example force traces during 10 lengthening contractions of mdx and WT mouse EDL muscle ex vivo after incubation with the indicated concentrations of EDG-5506. (C) Normalized peak strain with each contraction of the injury protocol (n = 4–8). (D) Isometric force drop from the first to the last contraction as a function of EDG-5506 concentration. (E) Peak strain drop from the first to the last contraction as a function of EDG-5506 concentration. (F–H) WT and mdx mouse TA muscle force in situ (WT, n = 6; mdx vehicle, n = 17; mdx EDG-5506, n = 3–5 each). (F) Change in isometric force as a function of EDG-5506 dose, represented as a percentage of initial force 3 hours after oral gavage of vehicle or EDG-5506. (G) Isometric force drop 10 minutes after 2 lengthening contractions, represented as a percentage of preinjury force. All indicated comparisons were made again using 0 μM EDG-5506 (data not shown). (H) CK activity 1 hour after in situ injury (n = 7–11). Data are shown as the mean ± SEM. Significance was calculated by 1-way ANOVA with Dunnett’s multiple-comparison test. *P < 0.05; **P < 0.01; ***P < 0.001; ****P < 0.0001. All indicated comparisons were made against results obtained after treatment with vehicle (0 μM EDG-5506).

