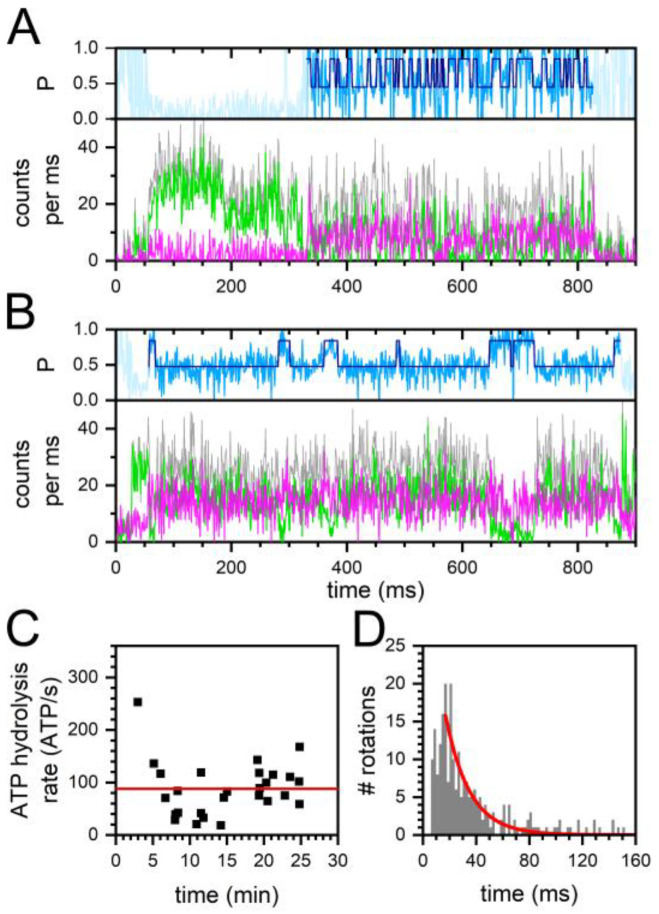
Figure 2.
Turnover of single FRET-labeled FoF1-ATP synthases in the presence of 30 μM ADP and 70 μM ATP. (A,B) time traces of FoF1-ATP synthases with (A) fast and (B) slow ε-subunit rotation. FRET donor Cy3B photon counts per ms (green traces), FRET acceptor Alexa Fluor 647 photon counts (magenta traces), associated proximity factor P time trace in light blue, HMM-assigned FRET states in dark blue (two states). The sum intensities of FRET donor and acceptor photons are shown as gray traces. (C) Active enzymes with mean individual ATP hydrolysis rates over the complete 30 min recording time after addition of ADP/ATP. Mean ATP hydrolysis rate is shown as red line. (D) Duration of full rotations (i.e., a FRET state pair comprising one high FRET plus one subsequent low FRET state) of all active enzymes, and monoexponential decay fit (red line).

