Figure 4.
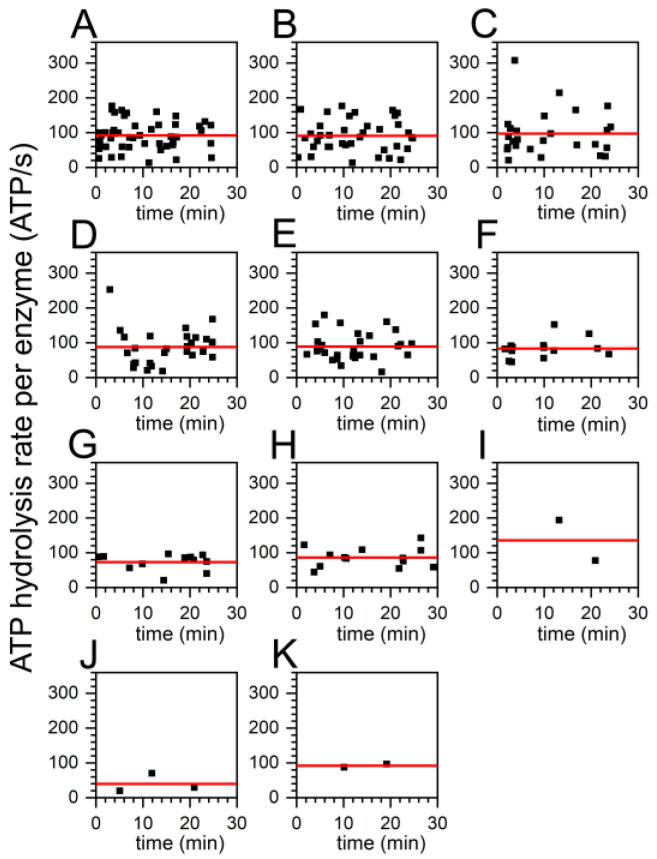
Mean turnover of individual FRET-labeled FoF1-ATP synthases (black squares) in the presence of 11 different ADP/ATP ratios as observed in the first 30 min recording time after addition of the ADP/ATP mixture. The ADP/ATP ratios were (A) 0/100, (B) 10/90, (C) 20/80, (D) 30/70 as in Figure 2C above, (E) 40/60, (F) 50/50, (G) 60/40, (H) 70/30 as in Figure 3C above, (I) 80/20, (J) 90/10, and (K) 100/0, nucleotide concentrations in μM. The average ATP hydrolysis rates were calculated from the mean turnover per enzyme and are shown as red lines.

