Figure 7.
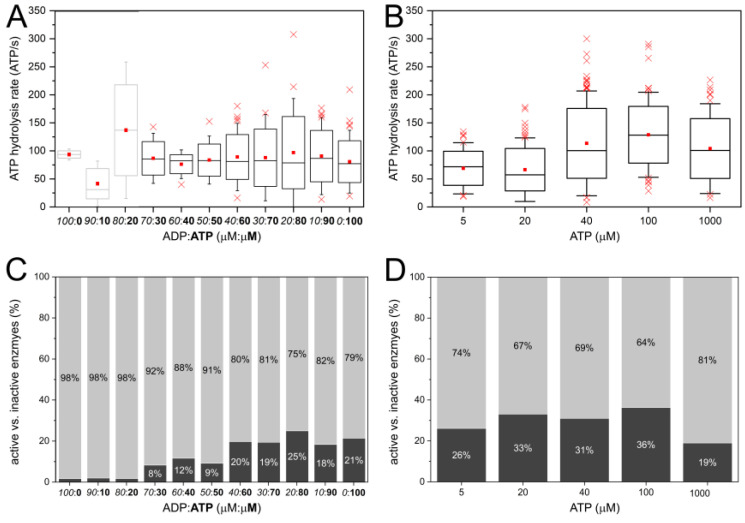
(A,B) Box plots of mean individual turnover of individual FRET-labeled FoF1-ATP synthases, (A) in the presence of 11 different ADP/ATP ratios and (B) in the presence of ATP only at five different concentrations (in μm). Red crosses were outliers, red squares were the arithmetic means. (C,D) Percentage of active (dark gray fraction) and inactive enzymes (light gray fraction), (C) in the presence of different ADP/ATP ratios, and (D) in the presence of ATP only. The data for the ATP-only figures (B,D) were obtained by re-analyzing our previous smFRET measurements [32], and by applying FRET state assignments with the DISC HMM software described in Section 4.

