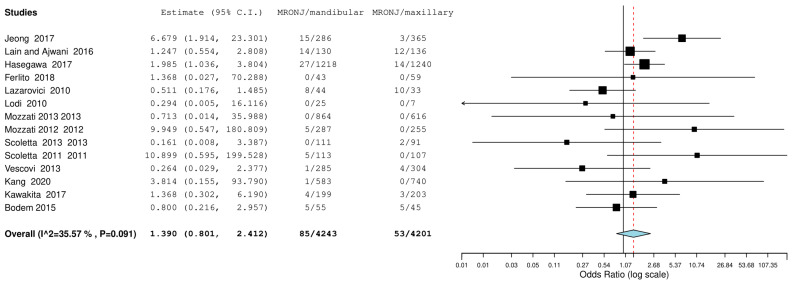
Figure 2.
Binary random effects model metric; odds ratio: 1.390; C.I. (Confidence Interval): (lower bound) 0.801 (upper bound) 2.412; p-value 0.241; Q = Q statistic (measure of weighted squared deviations); df = degrees of freedom; I2 (I^2) = Higgins heterogeneity index, I2 < 50%, heterogeneity low; P = p value; heterogeneity (Het.): tau^2: 0.315; Q (df = 13) 20.178, Het. p-value: 0.091, I^2: 35.574; Results (log scale): 0.329 (−0.221, 0.880), Standard error (SE): 0.281; Weights: Jeong: 10.945%, Lain and Ajwani: 16.231%, Hasegawa: 18.572%, Ferlito: 1.814%, Lazarovici: 12.918%, Lodi: 1.760%, Mozzati 2013: 1.829%, Mozzati 2012: 3.154%, Scoletta 2013: 2.887%, Scoletta 2011: 3.140%, Vescovi: 5.024%, Kang: 2.646%, Kawakita: 8.692%, Bodem: 10.390%. Correction factor = 0.5 (applied only to values of 0). The graph of each study shows the first author and the date of publication as well as the measurement of the number of MRONJs on the total and the relative OdRa with the confidence intervals reported. The final value with the relative confidence intervals is expressed in bold. Jeong et al., 2017 [36], Lain and Ajwani, 2016 [37], Hasegawa et al., 2017 [22], Ferlito et al., 2011 [38], Lazarovici et al., 2010 [40], Lodi et al., 2010 [41], Mozzati et al., 2013 [43], Mozzati et al., 2012 [44], Scoletta et al., 2013 [48], Scoletta et al., 2011 [49], Vescovi et al., 2013 [50], Kang et al., 2020 [52], Kawakita et al., 2017 [53], Bodem et al., 2015 [55].

