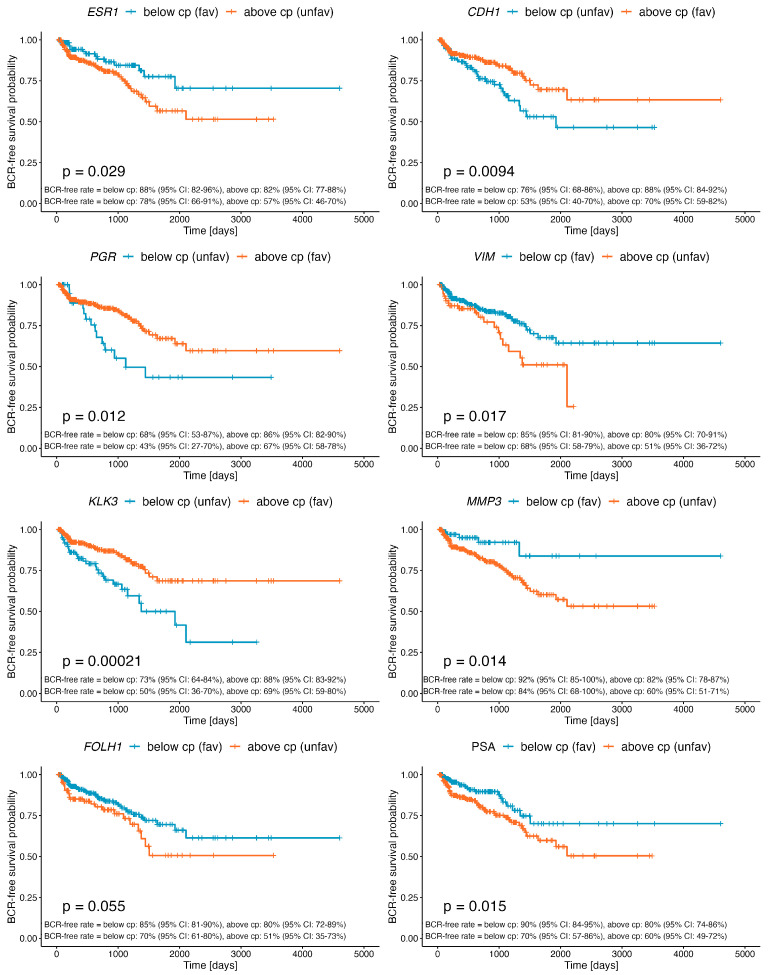
Figure 1.
Kaplan–Meier curves demonstrating differential BCR-free survival of PRAD patients stratified by the determined cutpoint for the expression of ESR1, PGR, KLK3, FOLH1, CDH1, VIM, MMP3, and preoperative PSA level. Detailed statistics of the above analyses are presented in Table 1.

