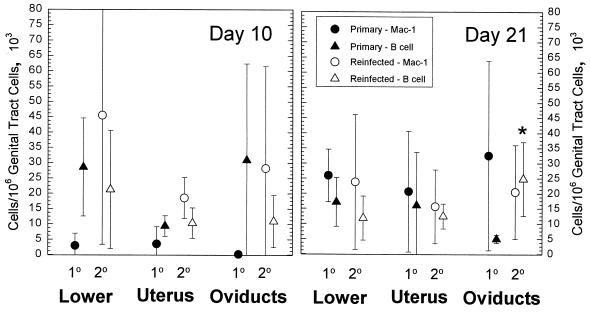
FIG. 4.
Comparison of B-cell and Mac-1-expressing-cell numbers in different areas of the genital tract 10 and 21 days after a primary GPIC intravaginal infection and after reinfection 50 days after the primary infection. The error bars represent the standard deviations of the means of results from four guinea pigs at each point in the primary group and six animals in the reinfection group. The asterisk indicates statistical significance at a P value of <0.03 according to a t test.

