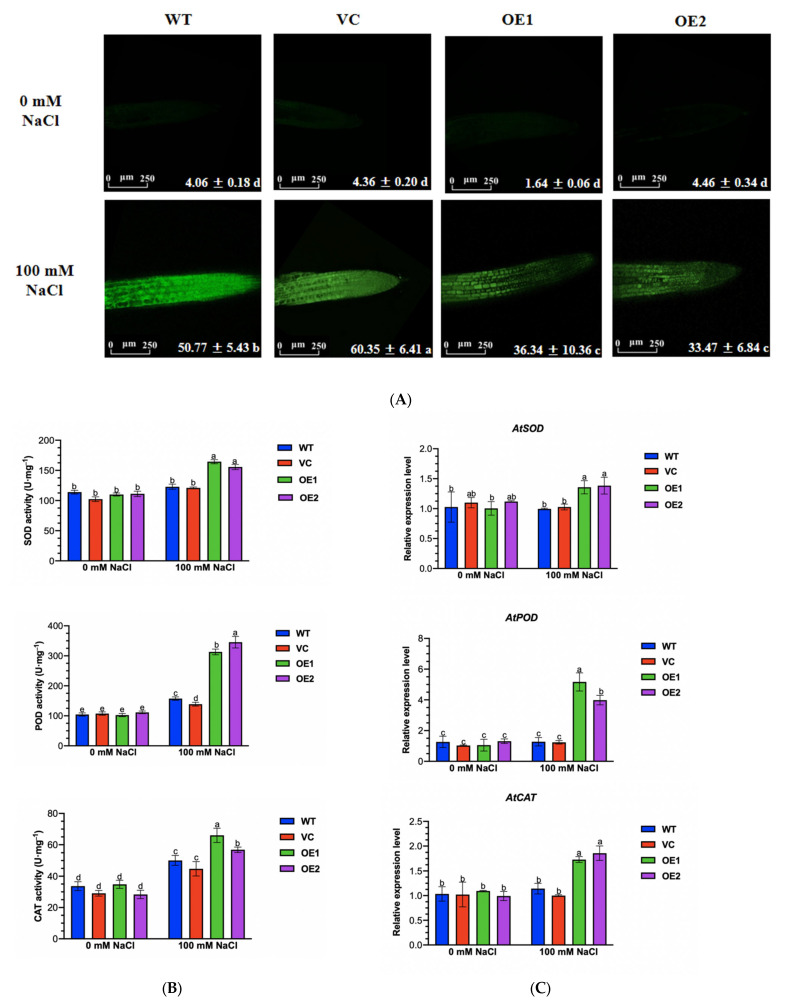
Figure 10.
H2O2 level, activity, and transcription of antioxidant enzymes. (A) H2O2 concentration in root cells. Seven-day-old WT seedlings, VC, and PeGLABRA3-transgenic lines OE1 and OE2 were exposed to 0 or 100 mM of NaCl for 12 h. Arabidopsis roots sampled from the control and salt-stressed plants were incubated with 10 μM H2DCFDA for 15 min and washed four or five times. The intracellular green fluorescence was detected by a confocal laser microscope. Each value is the mean of three independent experiments, and different letters (a–d) indicate a significant difference at p < 0.05. Scale bar = 250 μm. (B,C) Activity and transcription of antioxidant enzymes. Seven-day-old WT seedlings, VC, and PeGLABRA3-transgenic lines OE1 and OE2 were exposed to 0 or 100 mM of NaCl for 7 days. The total activity of SOD, POD, and CAT and transcription of the encoding genes AtSOD, AtPOD, and AtCAT were examined. Arabidopsis β-actin 2 (AtACTIN2) was used as the internal reference gene. Primers for AtSOD, AtPOD, AtCAT, and AtACTIN2 are listed in Supplementary Table S1. Each column is the mean of three independent experiments, and different letters (a–e) indicate a significant difference at p < 0.05.

