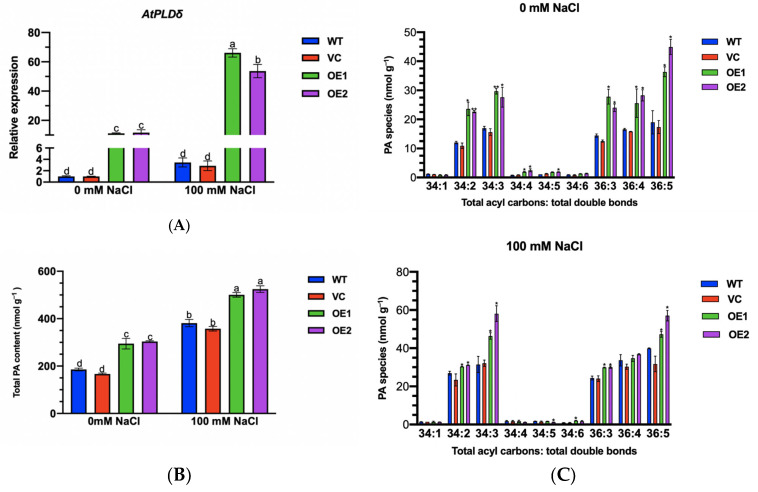
Figure 12.
AtPLDδ transcription and phosphatidic acid (PA) content. (A) AtPLDδ transcription. WT seedlings, VC, and PeGLABRA3-transgenic lines OE1 and OE2 were germinated and grown on 1/2 MS medium for 7 d. The seedlings were transferred to a liquid medium containing 0 or 100 mM of NaCl for a further 7 d. Transcription of AtPLDδ was examined, and Arabidopsis β-actin 2 (AtACTIN2) was used as the internal reference gene. Primers for AtPLDδ and AtACTIN2 are listed in Supplementary Table S1. Each column is the mean of three independent experiments, and different letters (a–d) indicate a significant difference at p < 0.05. (B,C) Phosphatidic acid (PA) content. Seven-day-old WT seedlings, VC, and PeGLABRA3-transgenic lines were transferred to a liquid medium containing 0 or 100 mM of NaCl for 24 h. Seedlings sampled from control and stressed plants were used to measure total PA content and the concentration of specific PA species, including 34:1, 34:2, 34:3, 34:4, 34:5, 34:6, 36:3, 36:4, and 36:5. Phosphatidic acid species were identified and quantified using electrospray ionization tandem mass spectrometry. Each column is the mean of three independent plants, and different letters (a–d) or asterisks (*) represent significant differences at p < 0.05, (**) represent significant differences at p < 0.01.

