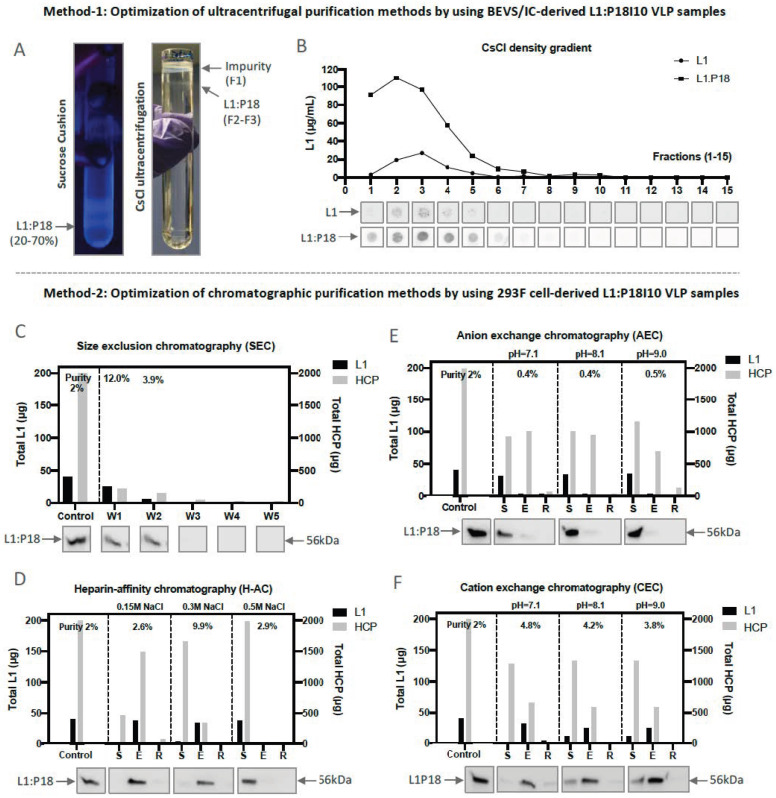
Figure 2.
Optimization of L1:P18I10 VLPs purified by using ultracentrifugal or chromatographic methods. (A) Purification of L1:P18I10 VLPs using ultracentrifugal methods. L1:P18I10 VLPs were partially purified by a two-step SC (left) and, subsequently, fractionated by CsCl gradient (right). The concentrated L1:P18I10 VLPs were indicated by the arrows. (B) Detection profiles of L1:P18I10 VLPs in CsCl density gradient. The CsCl gradient was fractionated from the top of the tube (F1-F15, 400 μL per fraction). Fraction 1 corresponds to the top of the tube. The signal of L1:P18I10 VLPs in each fraction was detected by dot blot, using anti-HPV16 L1 mAb. The HPV16 L1 VLPs were used as a positive control. The peak of the line graph indicates the corresponded fraction in which VLPs were detected. (C) Optimization of SEC. (D) Optimization of H-AC. (E) Optimization of AEC. (F) Optimization of CEC. In each independent test, a total 2 mg of soluble 293F cell lysate containing around 2% of L1:P18I10 VLPs was loaded into the column. The flow-through (FT) collected from each purification step were loaded on SDS-PAGE gels, which were Coomassie-stained, and analyzed by Western blot, using HPV16 L1 mAb. The arrow indicates the molecular weight ~56 kDa of L1:P18I10 protein. The L1 and HCP were quantified by densitometric assay using Image Studio Lite 5.x software and represented in column charts. Purity (%) was determined by the ratio of L1 to HCP. Control: soluble cell lysate; W1-5: eluate collected from washing step; S: flow-through (FT) collected from sample loading; E: eluate collected from elution; R: FT collected from 2M NaCl regeneration step.

