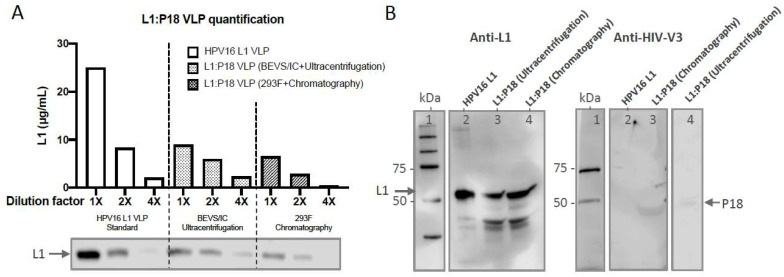
Figure 6.
Characterization of ultracentrifugation- and chromatography-purified L1:P18I10 VLPs. (A) Quantification of L1:P18I10 VLPs. The concentration of purified L1:P18I10 VLPs by using both methods was extrapolated from a standard curve of HPV16 L1 VLPs plotting dilution factors versus concentration. The L1 band intensity from the Western blot was quantified by densitometric assay using Image Studio Lite 5.x software and illustrated in a bar diagram. (B) HPV-16 and HIV-1 epitope detection of L1:P18I10 VLPs. Purified L1:P18I10 VLPs were analyzed by Western blot, using anti-HPV16 L1 (left) and anti-HIV1 V3 mAb (right). The recombinant HPV16 L1 VLPs were used as a control. The position of the L1 (55 kDa) and L1:P18I10 (56 kDa) proteins are indicated by the arrow on the left and right, respectively. Lane 1: protein molecular weight marker; Lane 2: HPV16 L1 VLP; Lane 3: BEVS/IC-derived and ultracentrifugation-purified L1:P18I10 VLP; Lane 4: 293F-derived and chromatography-purified L1:P18I10 VLP.

