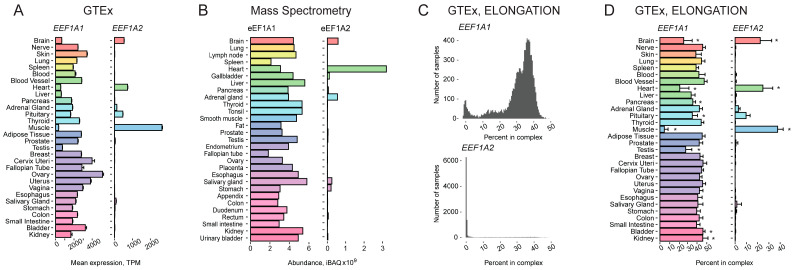
Figure 1.
Tissue-specific expression pattern of two human genes encoding eEF1A paralogs, EEF1A1 and EEF1A2. (A) Expression of the EEF1A1 and EEF1A2 genes in various human tissues according to GTEx. (B) Levels of eEF1A1 and eEF1A2 proteins in various human tissues according to high-throughput proteomic analysis [1]. (C) Histograms showing the distribution of the percentage of EEF1A1 (top) and EEF1A2 (bottom) expressions among the genes from the “ELONGATION” complex across various human tissues, according to GTEx. (D) Percentage of EEF1A1 and EEF1A2 expressions among the genes from the “ELONGATION” complex across various human tissues, according to GTEx. TPM, Transcripts Per Kilobase Million; *, FDR corrected p-value < 0.01 in enrichment analysis (fgsea R package).

